

Long-term technical outlook on recent stock volatility from Al Brooks.
All major stocks indices are now officially in a bear market (a 20% drop from high). But the E-mini S&P 500 started to reverse up from a parabolic wedge sell climax on Friday. There will probably be a strong short covering rally for the next two weeks.
Until February, the E-mini S&P 500 futures was in a strong bull trend since 2009 on its monthly chart (see below). I have made the point many times that the buy climax at the end of 2017 was the most extreme in history. This was true on the daily, weekly and monthly charts. There was likely to be a pause and then one more leg up before a bigger pullback.
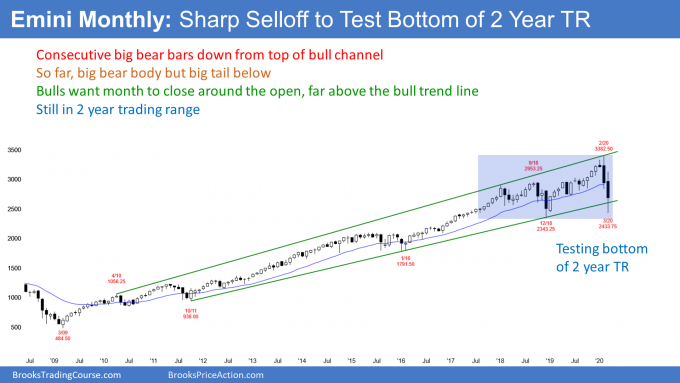
That is what happened. Last year was a second buy climax after two sideways years. The stock market reversed down violently over the past two months on the monthly chart.
But two down months do not make a bear trend. It is more likely that the selloff on the monthly chart will be a bear leg in what will become a trading range for several months. However, the odds favor a bear trend on the monthly chart, whether or not there is a trading range for several months first.
There is support at the December 2018 sell climax low. This initial selling might have stopped this week around that low. The big tail on the bottom of the March candlestick is a sign of strong buying.
Possible head and shoulders top later this year
If there is a bounce that lasts several months and then another reversal down, traders will wonder if the two-year trading range is a head and shoulders top. If the bears get a lower high with good sell signal bar, there would be a 40% chance of a bear trend.
While any one signal has a 40% chance of leading to a bear trend, there is a 50% chance of a bear trend beginning on the monthly chart within the next 12 months.
The obvious bear target would be a measured move down based on the height of the two-year trading range. Remember, there might be a head and shoulders top if there is several months of sideways trading. That measured move would be around the bottom of the 2014-2015 trading range, which would be about a 40% correction.
Sideways for the next decade
I said in late 2017 that there would be a top within five years that would lead to a couple 40% to 50% corrections over the next decade. The February high could be that top. But the monthly chart might go sideways for a year or more before there is a strong second leg down.
I also said that the stock market will probably be in a big trading range for the next decade. This is true even if there are one or more brief new highs during the decade.
Traders should still expect this because this is what typically happens after an extreme buy climax. Price gets far ahead of the fundamentals and it takes about a decade for the fundamentals to catch up. This happened in the 1970’s and the 2000’s.
Can this selloff be a bear trap?
Can this selloff simply be a sharp pullback in a 12-year bull trend? A bear trap? The bulls have a 30% chance of that. After consecutive buy climaxes (2017 and 2019) in the most overbought market in history, there is a 70% chance of at least two legs sideways to down.
The two-month selloff is forming the first leg down. Traders are deciding where this first leg down will end. It could end at any time. It might have ended this week.
But even if there is a strong reversal up over the next couple of months, the odds would still favor a second leg sideways to down after that rally. Traders should assume that the best that the bulls will get over the next couple months is a bounce in a trading range and not a resumption of the bull trend.
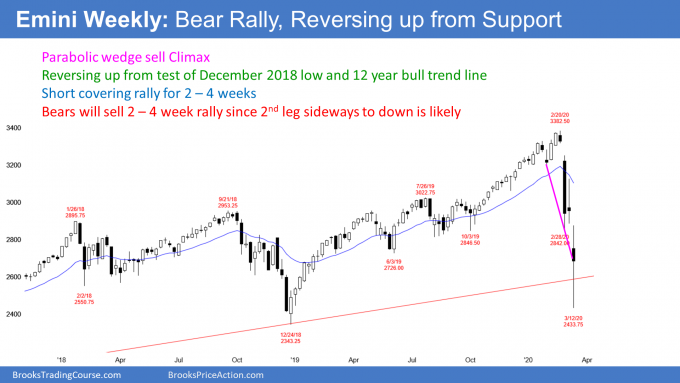
The E-mini sold off strongly over the past three weeks (see weekly chart below). It broke below the 12-year bull trend line but held above the December 2018 bottom of the two-year trading range. The strong, late buying on Friday lifted the week’s close above the bull trend line and back to the middle of the week’s range.
Can the selloff continue straight down to below the December 2018 low of 2343.25? There is a 40% chance at this point that the collapse will reach that target before there is at least a two-week bear rally.
The selloff has been exceptionally extreme. Many bears will be eager to take some of their exceptional profits soon. Additionally, a reversal up could be violent. It might have begun in the final 30 minutes on Friday.
We are getting near the end of the quarter. The last two weeks of March have a bullish bias. That is another factor that could contribute to a sharp short covering rally soon.
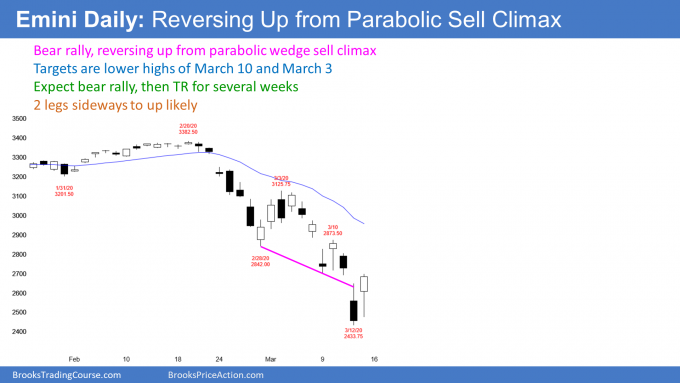
The daily E-mini chart is in a bear trend. A bear trend refers to the behavior of the chart (see below).
Once a selloff reaches 20%, there is a bear market in addition to a bear trend. The S&P 500 cash index, the Dow, and the Nasdaq all closed 20% below their all-time highest closes this week. They are also in bear trends on the daily and weekly charts.
When there is a bear market, the final low is typically much lower than 20%. The median selloff is 28% and it lasts 13 months. It then takes 21.9 months on average to make a new high. My shorthand way to think about this is that I expect a bear market to fall about 30% over a year and take two more years to make a new high.
There is lots of variability. Some bear trends end much sooner and barely fall more than 20%. Others last for years and fall more than 50%. It is too early to know what will happen this time.
But this selloff has been unusually severe. Also, the selloff followed extreme buy climaxes in 2017 and 2019. The one in 2017 was the most extreme in the history of the stock market. Furthermore, this was the longest bull trend in history. Traders should expect this bear market to fall more and last longer than average.
The E-mini has already fallen 28%
Last week’s low in the E-mini was 28% below the all-time high. Also, the S&P 500 cash index closed 27% down from its highest close on Thursday. Both have fallen as much as the average bear market.
It is important to note that Friday’s late rally put the close of the cash index at 2711.02. Why is that important? Because a 20% correction down from the highest close is 2708.92. That defines a bear market.
One of the goals of the bulls who created that huge 175 point rally in the final half hour on Friday was to get today’s close back above the 20% correction level. The bulls succeeded by two points!
Therefore, the bears only got one daily close below the magic price and they failed to get a weekly close below that price. Their case would have been stronger if they got consecutive daily closes below and a weekly close below. That is a sign that the bulls might be retaking control, at least temporarily. It increases the chance of a strong rally over the next two weeks.
Remember that bear trends typically have at least a small second leg down after the first strong reversal up. Consequently, last week’s low will probably not remain as the bottom of the bear trend. The odds are that the final low will be lower. That means the correction will be at least 30% down from the high. There is a 40% chance that it will be around 40% down.
Strong bear rally likely after parabolic wedge sell climax
As strong as the selloff was, there were three legs down in a tight bear channel. The third leg down broke far below the trend channel line drawn across the bottoms of the first two legs. That is a parabolic wedge sell climax. When it is extreme, it usually attracts profit taking by the bears.
Also, many bull traders will buy, expecting a strong short covering rally. I mentioned in the chat room on Friday that I bought SPY calls near the bottom of the morning selloff.
Everything will go up in a bear rally
It is important to note that all sectors sold off. They therefore will probably all rally. It is likely that value hunters will be buying just about everything for a trade up for a couple weeks.
The bears will be frantically buying back their shorts once they see the market not continuing down. But, after a couple legs up, they will look to sell again. They know the odds are that there will be a second leg down after such an extreme selloff.
The short covering rally after a wedge bottom typically has at least two legs sideways to up. It usually stalls at the top of the pullback from the second leg down. That is the March 10 high of 2873.50.
While that can be the end of the rally, it more often continues up to the start of the wedge bear channel. That is the March 3 high of 3125.75.
At the close of Friday, there was a 60% chance that the rally has begun. If Monday or Tuesday is a big bull day, there will be a 70% chance of a strong short covering rally.
Can the market continue to collapse? Unlikely. There is a 30% chance that the selloff will continue down to below the December 2018 low before there is more than a three-day bounce.
What to expect this week
The daily chart has had three legs down in a tight bear channel. This is a parabolic wedge selloff. That typically attracts profit takers, especially when the selloff has been extreme and especially when it is near major support. The December 2018 low and the 11-year bull trend line are major support.
Consequently, traders are looking for a one- to two-week bear rally to start within a week or so.
It might have begun with the very strong rally in the final 30 minutes of trading on Friday. If there is a gap up today, there would be a two-day island bottom. That would increase the chance of a strong bear rally.
We will provide additional market commentary on last week’s price action along with our view on a potential recession tomorrow. ab
Trading Room
Traders can see the end of the day bar-by-bar price action report by signing up for free at BrooksPriceAction.com. I talk about the detailed E-mini price action real-time throughout the day in the BrooksPriceAction.com trading room. We offer a two-day free trial.


