

The recent reversal in the long bond will lead to a range bound market but with large swings, reports Al Brooks.
The U.S. Treasury complex, particularly 30-year Treasury bond futures, have pulled back from an extreme buy climax. Traders expect a trading range for several months.
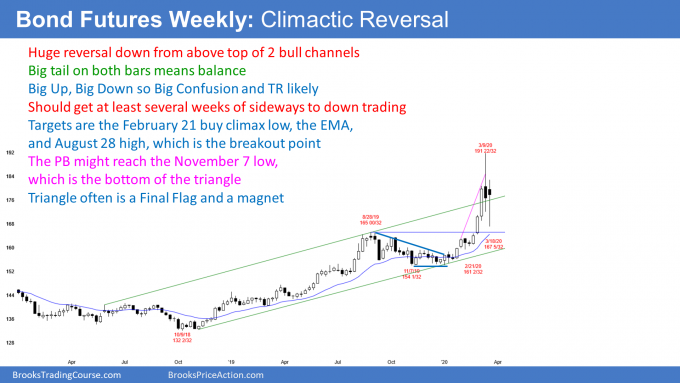
The 30-year Treasury bond futures market has pulled back for the past two weeks from its most extreme buy climax in history on the weekly and monthly charts. This reversal will probably continue sideways to down for a few months. Typical minimum objectives are two legs sideways to down and about 10 bars.
When there is a big up and then a big down move, there is big confusion. Traders look for reversals because they do not believe moves up or down will lead to trends. Consequently, traders should expect a trading range, possible for several months.
A reversal from a buy climax usually tests to the bottom of the most recent climactic rally. On the weekly chart, that is the low of those three big bull bars in the move up to last week’s top. That low is around 161. The top is usually around a lower high. On the daily chart (not shown), there was a lower high around 184. Consequently, the trading range might be between 160 and 185, which is huge.
If the likely trading range begins to form, many traders will look for fast money trades. This means the equivalent of scalps that last one to five 5 bars (weeks, since this is a weekly chart). They will buy reversals up from just above 160 to 165 and sell reversals down from 180 to 185. They will then take profits around the middle of the range.
Can the wo-week pullback be a bull flag?
Trends continue much longer than what seems reasonable. However, at some point, something happens that makes it likely that the trend has paused or ended. This strong reversal down from the extreme buy climax is enough to end the bull trend, at least for about 10 bars and two legs sideways to down.
At that point, if the bears have been unable to create a trend down, the bulls will start to buy again. They want the pullback to be a pause in the bull trend instead of the end of the trend. The bull trend probably will not attempt to resume up to a new high for at least a couple months.
Buy climax also on the monthly chart
The buy climax is also extreme on the monthly chart. If this month closes below the open, it will be a bear reversal candlestick on the monthly chart. Traders will then look for about 10 bars and two legs sideways to down on that chart as well. That means about a year. The target on that chart is the bottom of the most recent climactic leg up. That is the January low around 154.
Trading Room
Traders can see the end of the day bar-by-bar price action report by signing up for free at BrooksPriceAction.com. I talk about the detailed E-mini price action real-time throughout the day in the BrooksPriceAction.com trading room. We offer a two-day free trial.


