

Here is a breakdown of last week and what reports are due in the week ahead, from Joe Perry.
We have been seeing moves of 2%, 5% and even 10% in trading products across the board as volatility picks up amid the spread of the Coronavirus. The Federal Reserve went “All In” early in the week to continue to help keep the U.S. economy afloat. Other Central Banks such as the Bank of England and Bank of Canada also continued with aggressive measures. In addition, fiscal stimulus was all the rage this week, which ended with a $2.2 trillion package arriving on President Trumps desk Friday afternoon.
Gold ripped higher as physical supply deteriorated. Crude oil continued lower as the United States withdrew its bid to buy for the strategic petroleum reserve. Stock indices rallied hard last week, while the U.S. Dollar was down 3.25%.
Will we see volatility continue? Is the this the “new normal”?
The Coronavirus and the economic fallout will continue to be the main driver of the markets this week. Although the number of new cases in China have dwindling to a few, Italy and Spain are hitting highs in the number of deaths per day. In addition, the United States has surpassed them both in terms of number of overall cases. Also, Prime Minister Boris Johnson of the UK has tested positive for the virus, with mild symptoms. The world will be watching his recovery journey.
Last week, as the U.S. Fed began QE4 and many other programs to keep the markets flooded with cash, the U.S. Dollar Index (-3.25%) sold off and gave up all its gains from two weeks ago. As a result, many of the USD counter currencies had huge gains: GBP/USD +6.55%, AUD/USD +6.25%, NZD/USD + 5.77%, EUR/USD +3.76%, USD/JPY – 2.55%, and USD/CAD – 2.47%, just to name a few. Two weeks ago, the U.S. Dollar was given the “Flight to Safety” status. Many of RSI’s on these pairs have moved from oversold to neutral on the daily timeframes this week. In addition, many USD pairs are nearing 50% and 61.8% Fibonacci retracement levels, so we may see a correction this week.
As a result of the US Fed’s actions, gold has gone bid as well. However, there has been a large discrepancy between the futures market and the underlying physical market. In EFP (exchange for physical) markets, it seems that banks have been unable to secure the physical gold. Therefore, the spread between futures and physical has gapped wider. At one point, the spread was almost $65 wide. Some banks are liquidating EFP positions, which have forced the gap to tighten. The front month futures contract was up 9.33% last week, while the contract for difference (CFD) was up 8.48%.
President Trump had floated the idea that the United States would buy oil, at these low prices for the strategic petroleum reserve. This has pulled WTI Crude and Brent Crude off its lows. However, last week the US Energy Department decided against it, and sent WTI back towards its recent lows near $20.58. However, Russia may come back to the negotiating table as prices may be getting too low for their comfort.
After selling off hard two weeks ago, stock indices came roaring back with the Dow Jones up nearly 15%, the S&P 500 up 12.5%, and NASDAQ up 10.8%. In addition, the DAX was up 13.13% and the FTSE was up 12.1%. Note that stocks markets had moved into bear market territory in weeks prior. Be wary of the moves higher last week, as they may just be a bear market rally. In addition, Wednesday is quarter end. Many large pension funds need to rebalance their books so that they have the mandated U.S. Dollar amount of equities and bonds in their portfolios. With lower equity prices, funds may have been selling bonds and buying stocks, pushing indices higher. That could end by March 31. Note that during past selloffs of 30% or more in 1929 and 1987, stocks had strong short-term bounces, then continued to sell off.
For the week ending March 21, initial jobless claims were massive: 3,283,000 vs 282,000 the prior week. This was double economists’ estimates. With many industries shutting down and businesses closing, large and small businesses were forced to lay off workers. This week’s initial claims number is now the new benchmark. The current estimate for next week is roughly 3,000,000. Watch this data point to see if people continue to file for claims at this rate.
Below is a list of other important economic data to be released this week:
Monday
- EU: Business Climate (MAR)
- EU: Consumer Confidence (MAR)
- EU: Economic Sentiment (MAR)
Tuesday
- China: NBS Manufacturing PMI (MAR)
- China: NBS Non-Manufacturing PMI (MAR)
- US: Consumer Confidence (MAR)
Wednesday
- Global Manufacturing PMIs (MAR)
- Japan: Takan Large Manufacturing Index (Q1)
- Australia: RBA Meeting Minutes
- China: Caixin Manufacturing PMI (MAR)
- US: ISM Manufacturing PMI(MAR)
- US: ADP Employment Change
- Crude Inventories
Thursday
- US: Initial Jobless Claims
- US: Factory Orders
Friday
- Global Services PMIs (Mar)
- China: Caixin Services PMI (MAR)
- US: Non-Farm Payrolls
- US: ISM Non-Manufacturing PMI (MAR)
Chart of the Week: Daily GBP/USD
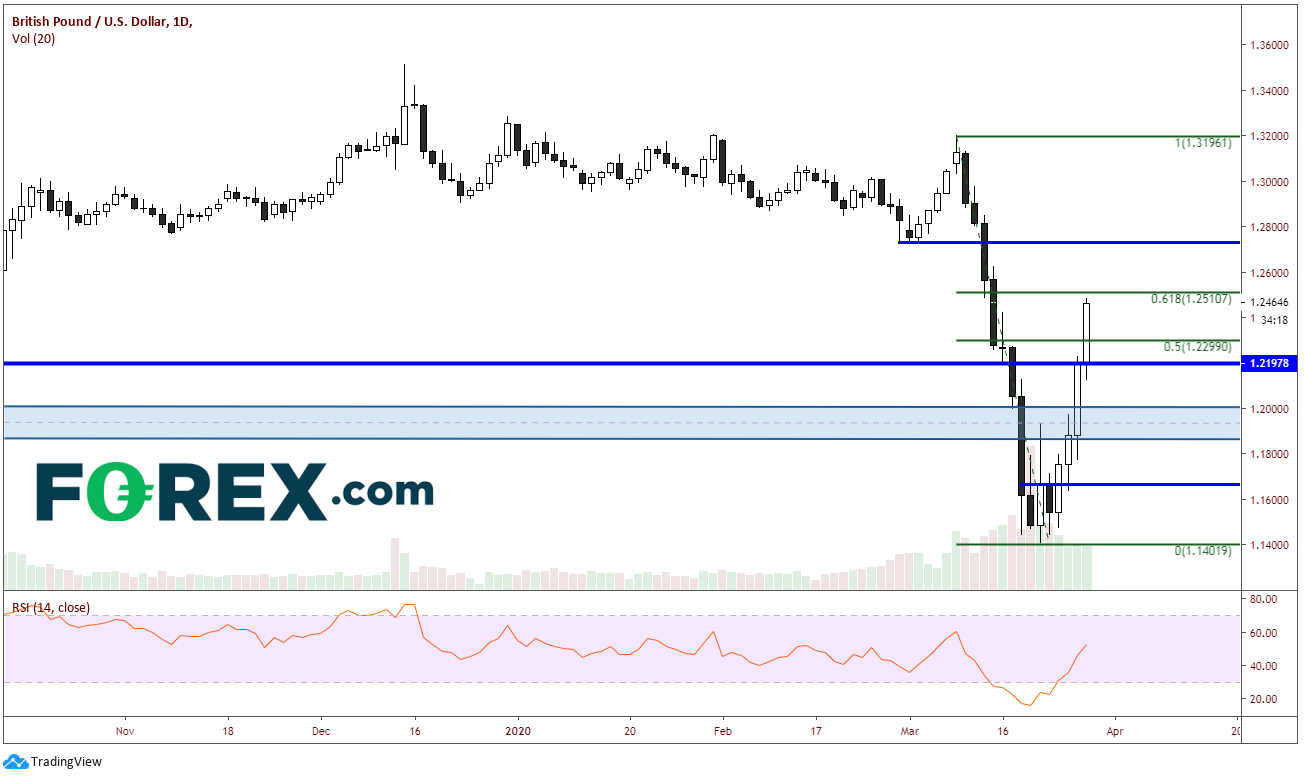
Source: Tradingview, FOREX.com
After selling off 11% since March 9, GBP/USD skyrocketed higher this week and gained nearly 7% of its loss, trading from 1.1670 to start the week and closed near the week’s higher at 1.2460. The pair retraced to just below the 61.8% Fibonacci level from the March 9 highs to the March 20 lows. Initial resistance at the 61.8% retracement level comes across at 1.2510. If the move continues higher, there are likely to be sellers at the horizontal resistance near 1.2725. Above that is the psychological resistance area at 1.3000. First horizontal support is near 1.2200, and then a band of support between 1.1860/1.2000. It’s crazy that the support and resistance areas are over 1000 pips apart, however this pair has been extremely volatile. If you trade this pair, use small size and proper risk management.
As we saw last week, there is tremendous volatility, as well as opportunity in these markets. These large percentage daily moves may be around as long as there is continued uncertainty surrounding the coronavirus. This may be the new normal for the weeks and months ahead!
Please stay safe and always wash your hands!
Joe Perry holds the Chartered Market Technician (CMT) designation and has 20 years of experience in the FX and commodities arenas. Perry uses a combination of technical, macro, and fundamental analysis to provide market insights. He traded spot market FX and commodity futures for 17 years at SAC Capital Advisors and Point 72 Asset Management. Don’t forget that you can now follow Forex.com’s research team on Twitter: http://twitter.com/FOREXcom and you can find more of FOREX.com’s research at https://www.forex.com/en-us/market-analysis/latest-research/.


