The euro has broken outside of both near-term support and resistance, but remains a bear until it fails to make new low, reports Al Brooks.
The EURUSD currency pair has a weak expanding triangle bottom. It will probably work a little higher, but then settle into a trading range.
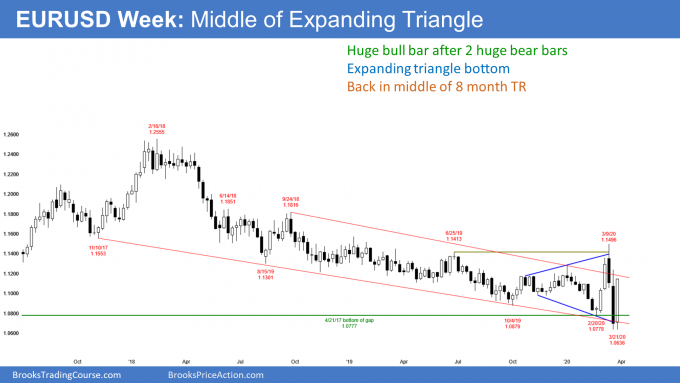
The EURUSD rallied sharply last week. It formed a big bull reversal candlestick on the weekly chart (see below). It is a buy signal bar for this week. Traders see the past eight-month trading range as an expanding triangle. That is a type of major trend reversal.

A good looking major trend reversal has a 40% chance of leading to an actual reversal up into a bull trend. After an extremely strong selloff like this one, until there is also a double bottom, there is only a 30% chance of this growing into a bull trend.
Prior to last week, there was a two-week collapse after a strong rally to above the 18-month bear trend line. That trend line is the top of the bear channel in the two-year bear trend. Last week the euro reversed higher after breaking below the bottom of the bear channel.
Minor reversal up for a couple weeks
While the bulls want as strong a reversal up as the reversal down was, that is unlikely. When there is a reversal up after a reversal down, it typically is minor. Traders usually want to see at least a small double bottom before they believe that a bull trend might be starting.
Therefore, as bullish as last week was, the context is not great. Context means the bars to the left. The bulls might be able to continue the reversal up for another couple weeks. However, it is unlikely to reach the March high without first testing the March low.
How high up can it go? A common target for a minor reversal up is the 50% retracement. This rally is already above that resistance. Less likely, the rally will reach the March high before testing the March low.
Can the bear trend fall to par?
No matter how strong any rally has been for two years, it was always followed by a new low. This is a bear channel. Even though the early March rally was by far the strongest in the two-year bear trend, the bears still turned the EURUSD down to a new low.
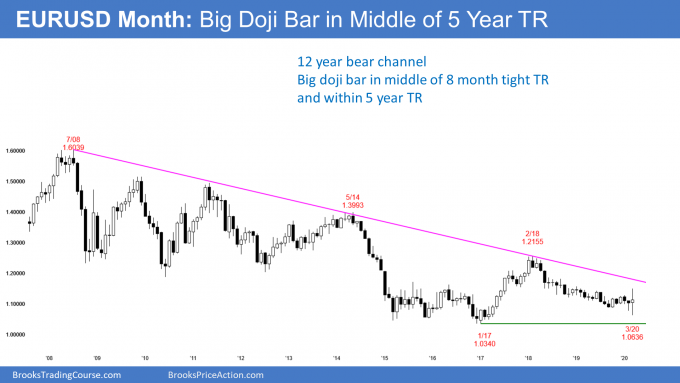
Traders are therefore looking at the next lower support levels. The first is the January 2017 low at the bottom of the strong 2017 rally. As long as the current two-year bear trend holds above that low, traders will wonder if the two-year selloff is just a protracted pullback from that bull trend. That means it is still a possible bull flag.
But if the EURUSD falls below that low, it will no longer be a possible bottom of the bear trend that began in 2008. They will then look at the next lower support. That is 1.00 (par).
Isn’t the U.S. creating inflation by printing dollars?
It is easy to argue that the EURUSD collapsed in March due to a flight to safety in U.S. markets. That means dollars. And then the EURUSD reversed up sharply this week when the Federal Reserve basically said that the United States would print “infinite dollars” to protect the economy.
I never pay attention to that because it is impossible to know why the institutions are buying or selling. All I know is that there was a strong break below an eight-month range and a strong reversal up. I also know that the first reversal up from a collapse usually will be followed by a test down. That is all that matters.
I want to go back to discredit the teleological arguments. Think about it. If the United States begins to print infinite dollars and it rescues the economy, what will the EU do? It will print infinite euros. China and Japan will also print infinite yen.
All of this cancels out. I don’t want to try to figure out who is doing more because it will not make me richer. The charts say this bounce has a little more to go and then there will be a test down.
Buyers below the 2017 low on the monthly chart
There is one trading days left in March. March reversed down from above the February high and up from below the February low. It is therefore on outside down bar.
However, it is now in the middle of the March candlestick. It is a huge doji candlestick (see chart below). That means it is neutral. Traders therefore do not expect a big move up or down in April.

Whenever a market falls below major support like the 2017 low, the breakout has a 50% chance of succeeding. Success means having at least a couple legs down, often to a measured move.
The two-year trading range is more than 2,000 pips tall. Given how the 12-year selloff can still be a bull flag on the monthly chart, there is only a 40% chance of a measured move down. There is a 60% chance that a break below the 2017 low will reverse up within a few month.
If it did, there would be an expanding triangle bottom, beginning with the March 2015 low. Furthermore, there would be a wedge bull flag where the first two lows are the November 2005 low and the January 2017 low.
Each bar on the monthly chart is one month. It could take more than a year for the EURUSD to fall below the 2017 low and then clearly reverse up.
Trading Room
Traders can see the end of the day bar-by-bar price action report by signing up for free at BrooksPriceAction.com. I talk about the detailed E-mini price action real-time throughout the day in the BrooksPriceAction.com trading room. We offer a two-day free trial.


