

China is the first country to suffer from the Coronavirus, will they be first to recover, asks Joe Perry.
Tuesday morning China will release their “Official” NBS Manufacturing PMI data for March. The expectation is for a reading of 45, which is still in contraction territory. However, a print of 45 is much better than the previous reading of 35.7. (A reading above 50 means the economy is in expansion and a reading below 50 means the economy is on contraction.)
In addition, the “Official” Non-Manufacturing PMI for March is also going to be released. There is not an estimate for this figure, however the previous reading was 29.6. The reason I say “Official” is because this data is put out by the Chinese government. Depending on who you ask, these readings may or may not be accurate as they could be. The more accurate data may come on Thursday, when the private company Caixin Global puts out their survey reading. Ironically, Caixin is expecting a reading of 45.8, slightly better than expectation on of the official reading. Regardless, with Coronavirus cases falling in China, and with factories and stores reopening, the number is likely to be better than last month.
If the data is worse than expected, the U.S. Dollar may continue to advance vs the Chinese yuan. The USD/CNH had put in a high of 7.1959 on Sept. 3, 2019 and began forming a sideways channel, hitting a low 0f 6.8456 on Jan. 20. After breaking out of a descending wedge and retesting the bottom of the channel on March 9, the pair shot higher back towards the top of the channel and is currently consolidating in a pennant formation. Price consolidations in a pennant formation usually break out is the same direction of the previous move. Therefore, we should look for a breakout higher. Notice that as price reached the high of the pennant, the relative strength index (RSI) was in overbought territory. This consolidation allowed for the RSI to move back within the neutral zone (see chart below).
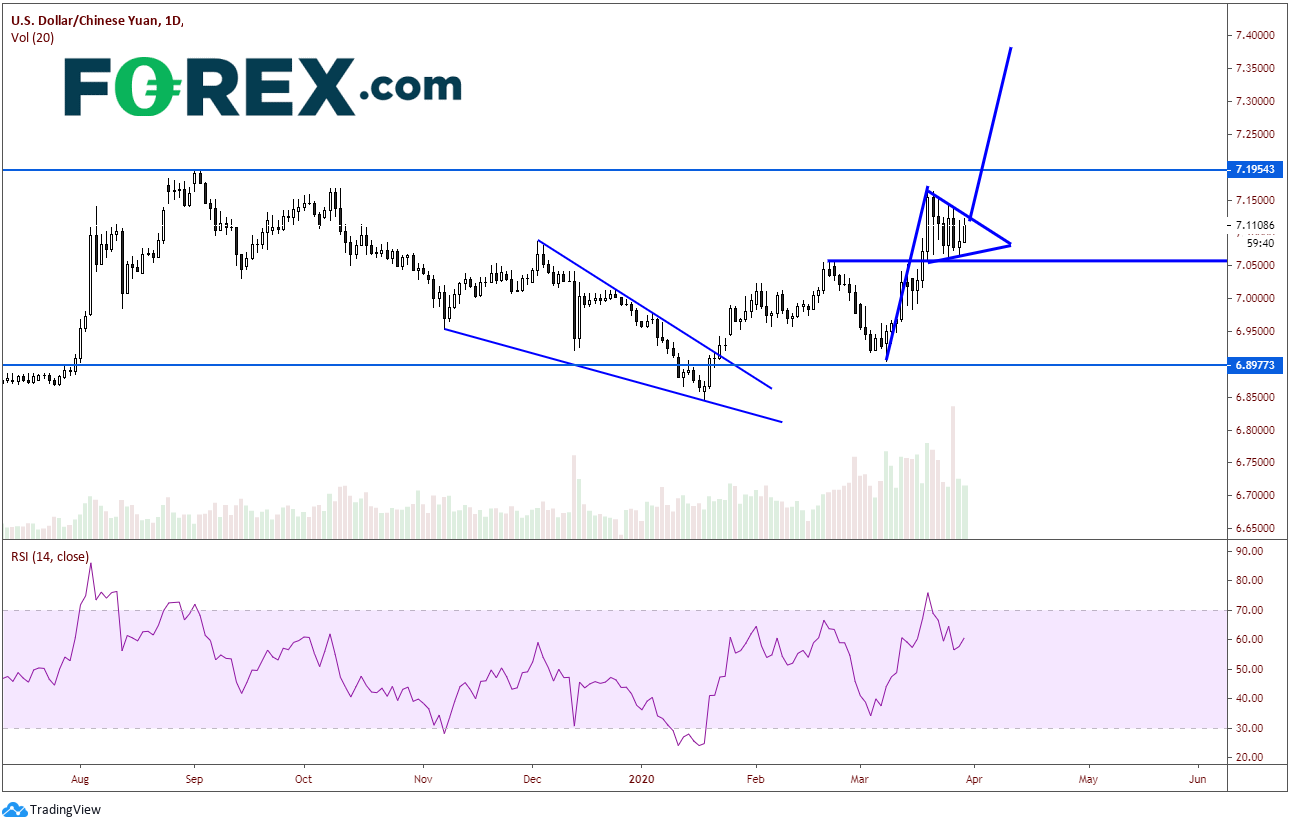
Source: Tradingview, FOREX.com
On a 240- minute time frame we can get a better sense of support and resistance levels. First resistance is at today’s highs and the downward sloping trendline from the pennant near 7.1300. Above there is the near-term high and top of the pennant at 7.1650. Finally, the all-time high from September is the third resistance level at 7.1854. First support is the upward sloping trendline from the bottom of the pennant near 7.07. Not far below that is the next level of horizontal support near 7.0571. Below there is the third level of support near the channel bottom at 6.9200 (see chart below).
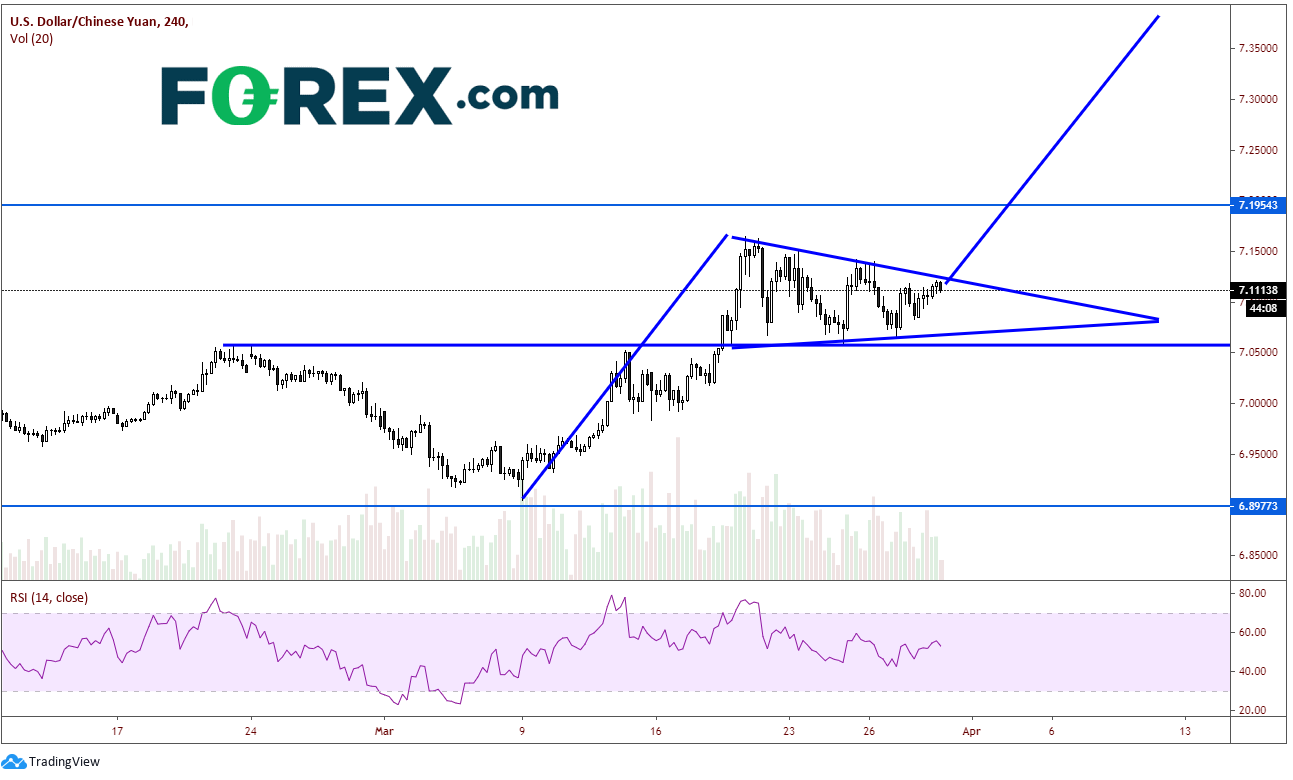
Source: Tradingview, FOREX.com
Whether or not the official Manufacturing PMI and Non-Manufacturing PMI readings are real or not, the Caixin figures will matter more. And given the price formation at the moment, watch for USD/CNH to break higher out of the pennant, and note the target is way above at 7.38.
Joe Perry holds the Chartered Market Technician (CMT) designation and has 20 years of experience in the FX and commodities arenas. Perry uses a combination of technical, macro, and fundamental analysis to provide market insights. He traded spot market FX and commodity futures for 17 years at SAC Capital Advisors and Point 72 Asset Management. Don’t forget that you can now follow Forex.com’s research team on Twitter: http://twitter.com/FOREXcom and you can find more of FOREX.com’s research at https://www.forex.com/en-us/market-analysis/latest-research/.


