

With volatile employment figures likely to roil FX markets, currency traders make seek to trade pairs unrelated to dollar, writes Joe Perry.
Last week, U.S. Initial Jobless Claims were 3,283,000 vs. an expectation of 1,500,000. It was the largest initial claims weekly filing in U.S. history, a level no one ever thought they would see in their lifetime. Later today, at 8:30 am EST, Initial Claims for the Week ending March 28 will come out. The expectation is for 3,500,000, with continuing claims expected to be 4,882,000! If the figure comes in close to expectations, that would be a two-week total of almost 6,800,000 filing for unemployment claims in the last two weeks! As the country continues to shut down, state by state, these numbers are likely to continue at this rate for the next month. President Trump said the earliest the U.S. would “reopen” would be April 30.
Yesterday, ADP released their Nonfarm Employment Change for March. The figure was -27,000 vs an expectation of -150,000. Tomorrow, the Employment Situation Reports comes out. Expectations are for a drop in nonfarm payrolls of 100,000 jobs. The unemployment rate is expected to uptick from 3.5% to 3.8%. The unemployment data overall is likely to get worse before it gets better. However, as initial claims are the most up to date data released, it will also be the number most focused on.
All of this comes as President Trump recently said that the United States expects 100,000 to 240,000 deaths from the Coronavirus. He stated yesterday that “we are going to have a couple weeks that will be horrific.”
Last Thursday, the day of the initial claims data release, the U.S. Dollar Index sold off 1.5% from 100.26 to 99.46. It has since been consolidating between 98.27 and just below horizontal resistance at 99.91. This is also the area between the 38.2% and 61.8% Fibonacci retracement levels from the March 9 low to the March 20 high. If the initial claims data is weak, and the Dollar Index sells off like it did last week, price could be down near 97.00 by the end of the day. The targeted move out of the pennant formation is near 95, or almost a 100% retracement back to the March 9 level. If the initial claims data is better, price could break out to the upside and trade near horizontal resistance at 101 (see chart).
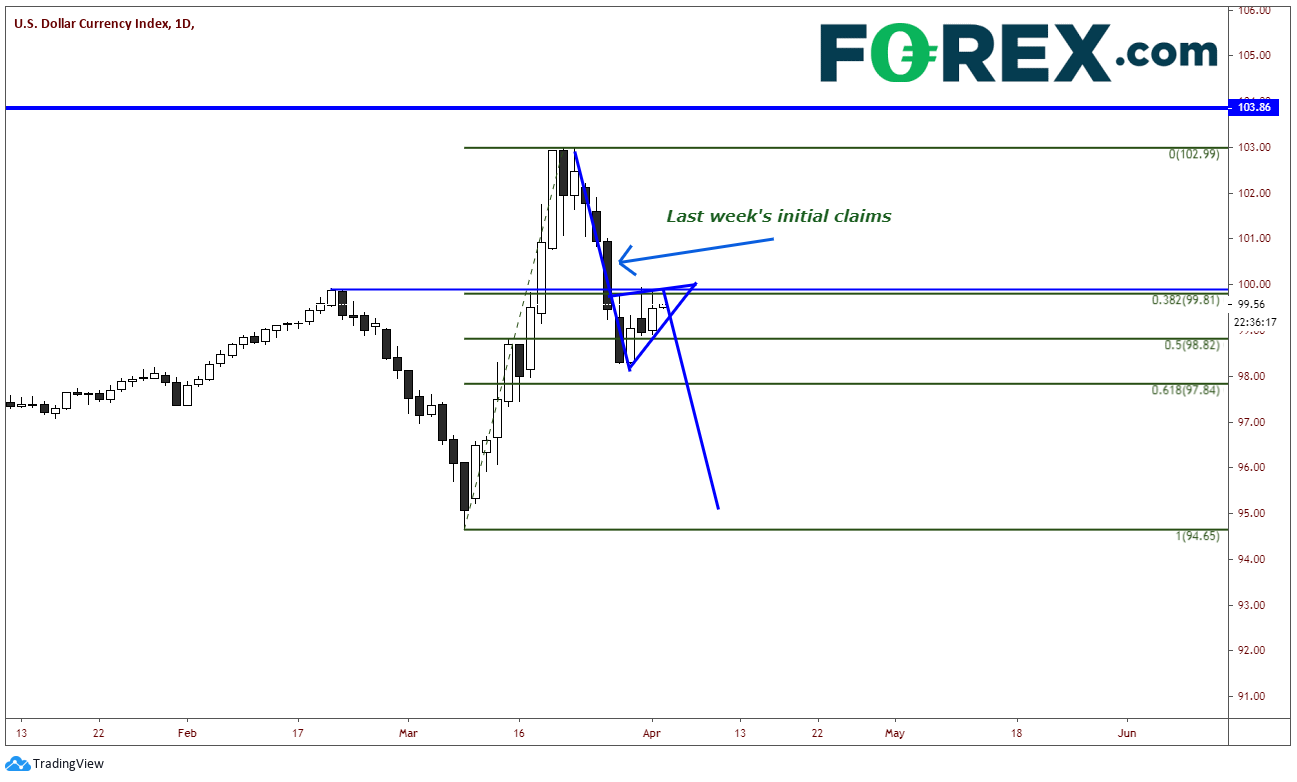
Source: Tradingview, FOREX.com
However regardless of the actual figure released, it will still be bad. And as the President has recently expressed, things are likely to remain dire for at least the next few weeks.
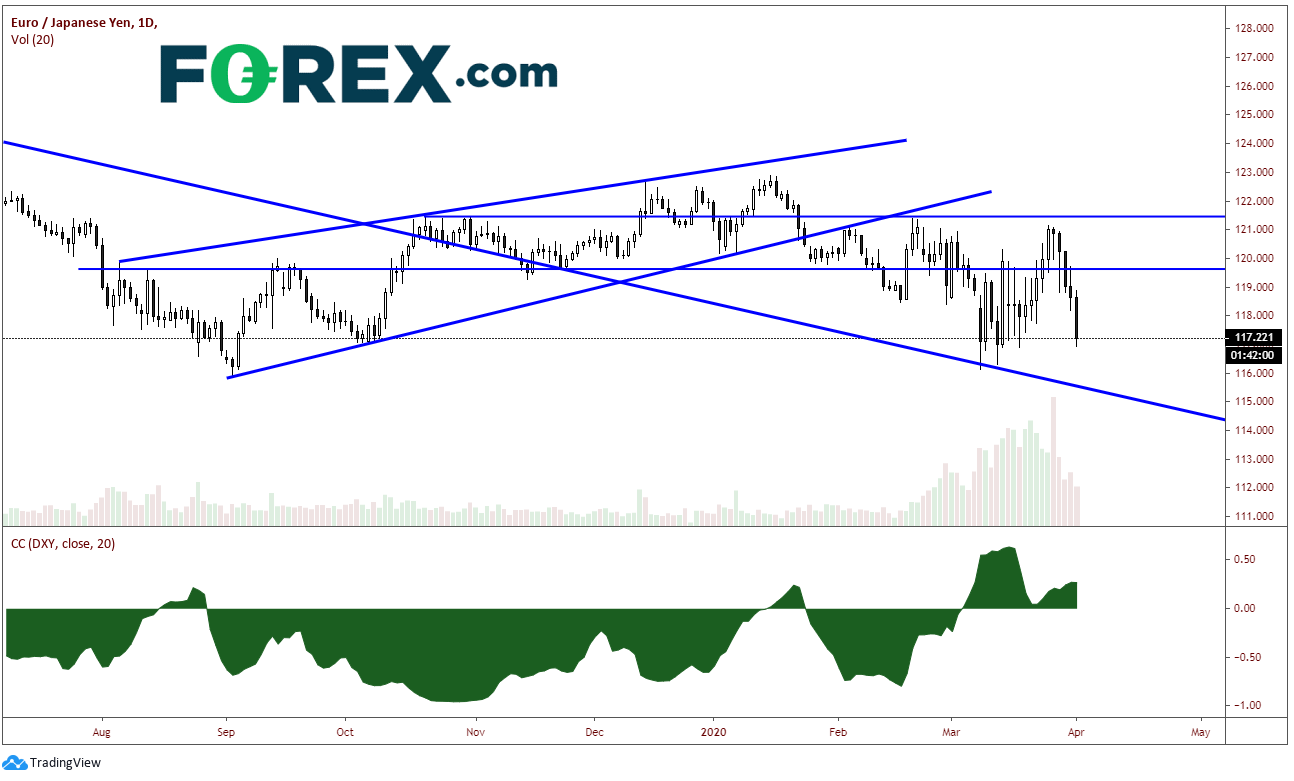
EUR/JPY Offers Volatility, Without Much USD Correlation
Since Feb. 20, when the S&P 500 began selling off from its all-time highs, the euroyen pair (EUR/JPY) has been trading in a volatile trading range between 116.12 and 121.40. However, over the last four trading days, the pair has traded lower from 121.08 to today’s lows near 116.96, down almost 1.5% Wednesday alone. Support doesn’t come in until 85/100 pips lower near 116.00, which is near the long-term downward slope and the March low (see chart).
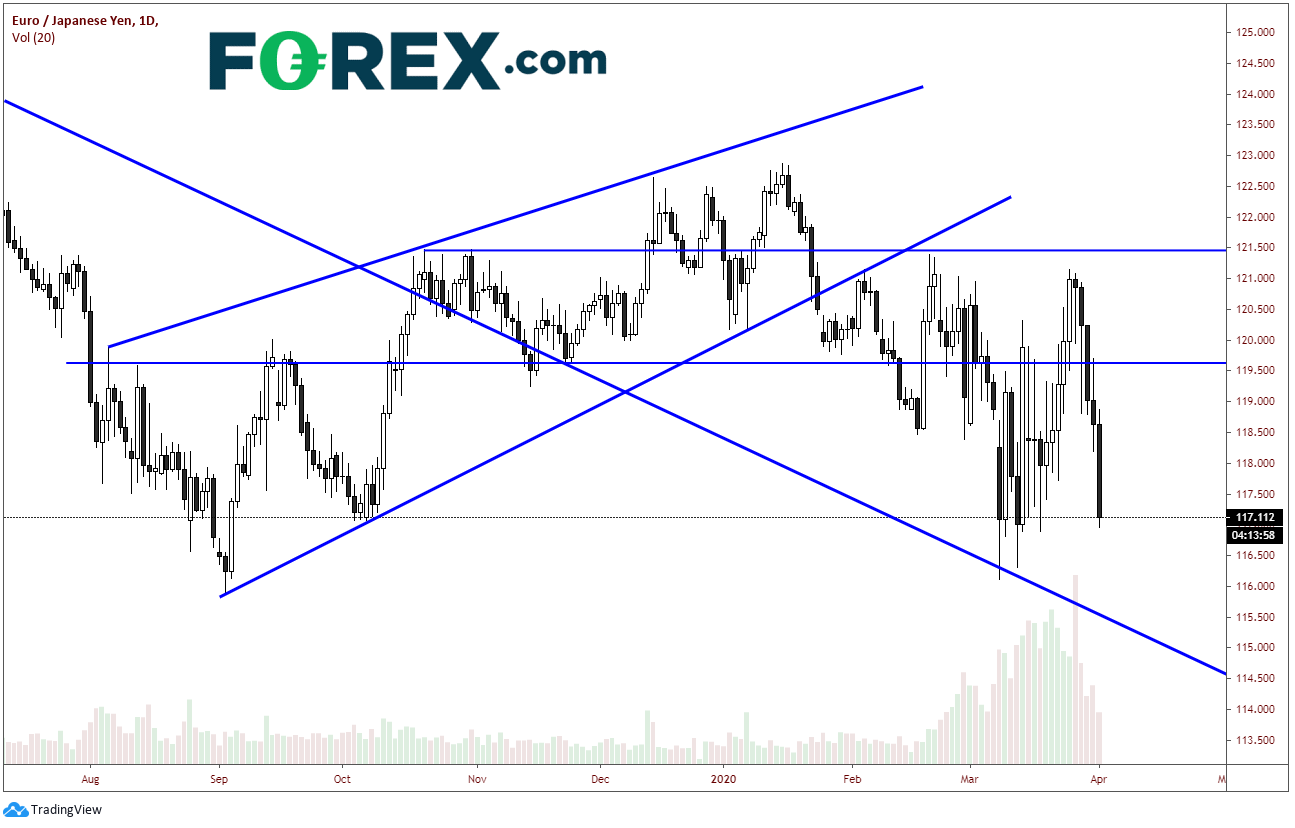
Source: Tradingview, FOREX.com
One reason for the move lower is because of USD/JPY, which has sold off from a recent high of 111.71 to today's lows of 107.00, while stalling between the 38.2% Fibonacci retracement level from the march 9 low to the March 24 high. As of late, the pair has a high positive correlation with the DXY at +0.92. A correlation coefficient of +1.00 means the pair move perfectly together in the same direction. Currently, there is a close correlation. Support is below at the 50% retracement level and horizontal support near 106.50.
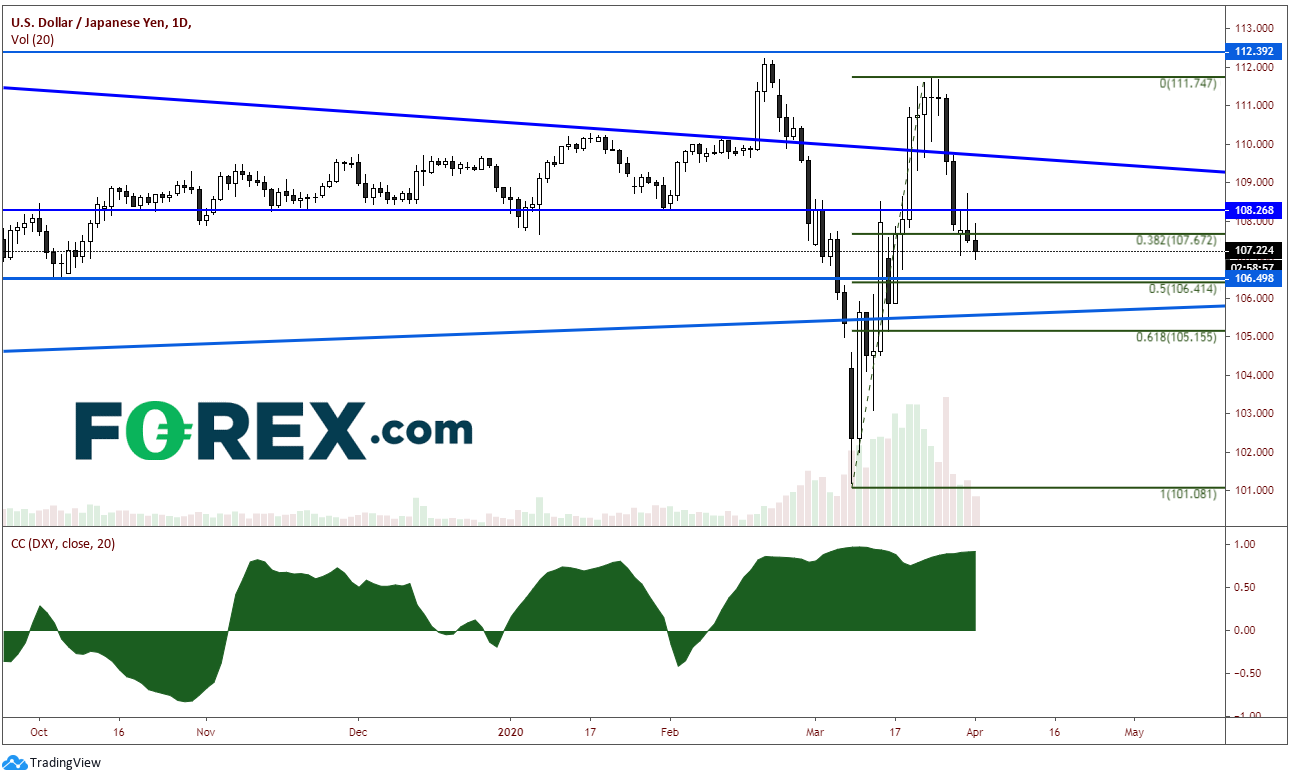
Source: Tradingview, FOREX.com
The other reason the EUR/JPY is moving lower is because of the EUR/USD side of the equation. The pair has been moving lower since Monday’s open. The EUR/USD traded up to the 61.8% Fibonacci retracement level from the highs on March 9 to the lows on March 23 before turning lower. Support is at today’s lows near 1.0900. Notice how highly negatively correlated the EUR/USD is with the DXY. The current reading is -0.99. A correlation coefficient of -1.00 means the two assets are perfectly negatively correlated (see chart).
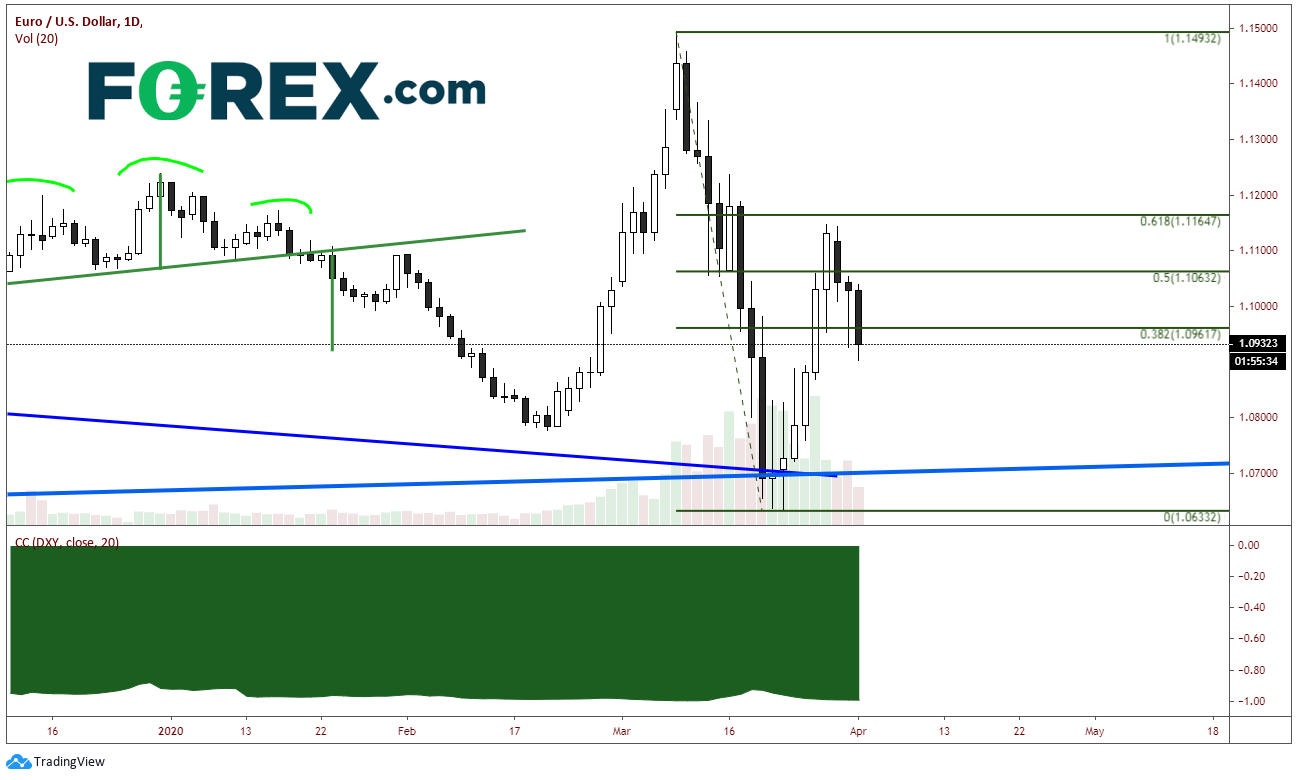
Source: Tradingview, FOREX.com
With the EUR lower vs. the USD, and JPY higher vs the USD (USD/JPY lower), it makes sense that the EUR/JPY would be much lower, especially with the high correlations that EUR/USD and USD/JPY have with the US Dollar. However, when we take a look at the correlation of the EUR/JPY to the DXY, the correlation coefficient is only +0.27! There is only a mild correlation to the DXY (see chart).
Source: Tradingview, FOREX.com
Here’s the point; With initial claims tomorrow and nonfarm payrolls on Friday, the U.S. Dollar currency pairs may continue to be volatile over the next few days. If you are looking for a currency pair to trade, but don’t want exposure to the dollar, EUR/JPY is a pair to consider.
Joe Perry holds the Chartered Market Technician (CMT) designation and has 20 years of experience in the FX and commodities arenas. Perry uses a combination of technical, macro, and fundamental analysis to provide market insights. He traded spot market FX and commodity futures for 17 years at SAC Capital Advisors and Point 72 Asset Management. Don’t forget that you can now follow Forex.com’s research team on Twitter: http://twitter.com/FOREXcom and you can find more of FOREX.com’s research at https://www.forex.com/en-us/market-analysis/latest-research/.


