

Several oil drilling stocks are showing exploitable chart patterns, reports Suri Duddella.
The spread of Coronavirus and fear of weakening crude oil demand triggered a sell-off in the energy industry. Oil drillers were among the hardest hit as onshore, and offshore drillers saw their stock fall significantly. As OPEC and OPEC + try and stabilize the oil prices, some oil drillers are showing signs of bottoming patterns.
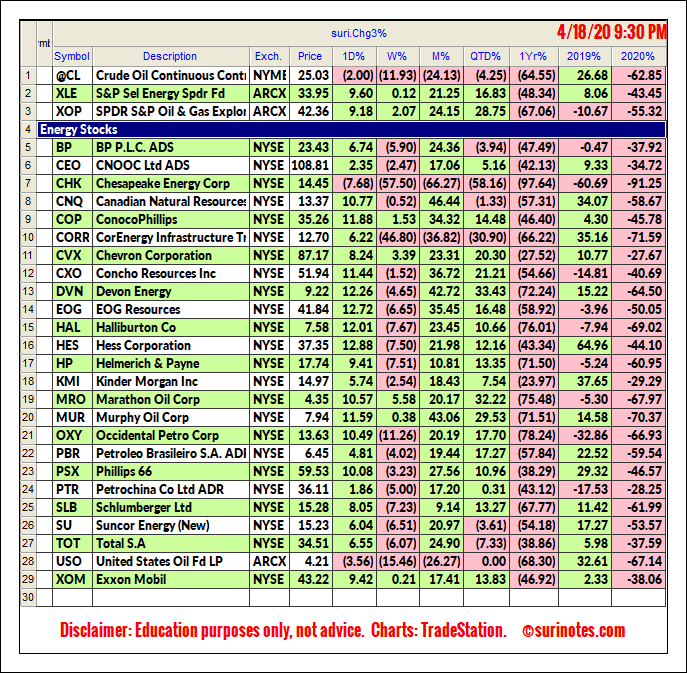
Below is a list of Energy stocks and ETFs:
Trading ABC Patterns
The ABC Chart pattern and its related AB=CD Chart Pattern are prime examples of "Symmetry" in the markets. These "Harmonic" patterns help traders to identify buying and selling opportunities in all markets and in all timeframes. The ABC and AB=CD patterns were first described by H.M. Gartley in his book, "Profits in the Stock Market."
The main advantages of trading harmonic patterns are that they allow traders to determine risk vs. reward ratios beforehand as they forecast key market turning points and profit targets for traders. The ABC pattern can be a continuous or reversal pattern and it is shaped like a lightning bolt.
Identification
The following chart show ABC Bullish pattern formation and its trade information in TradeStation software
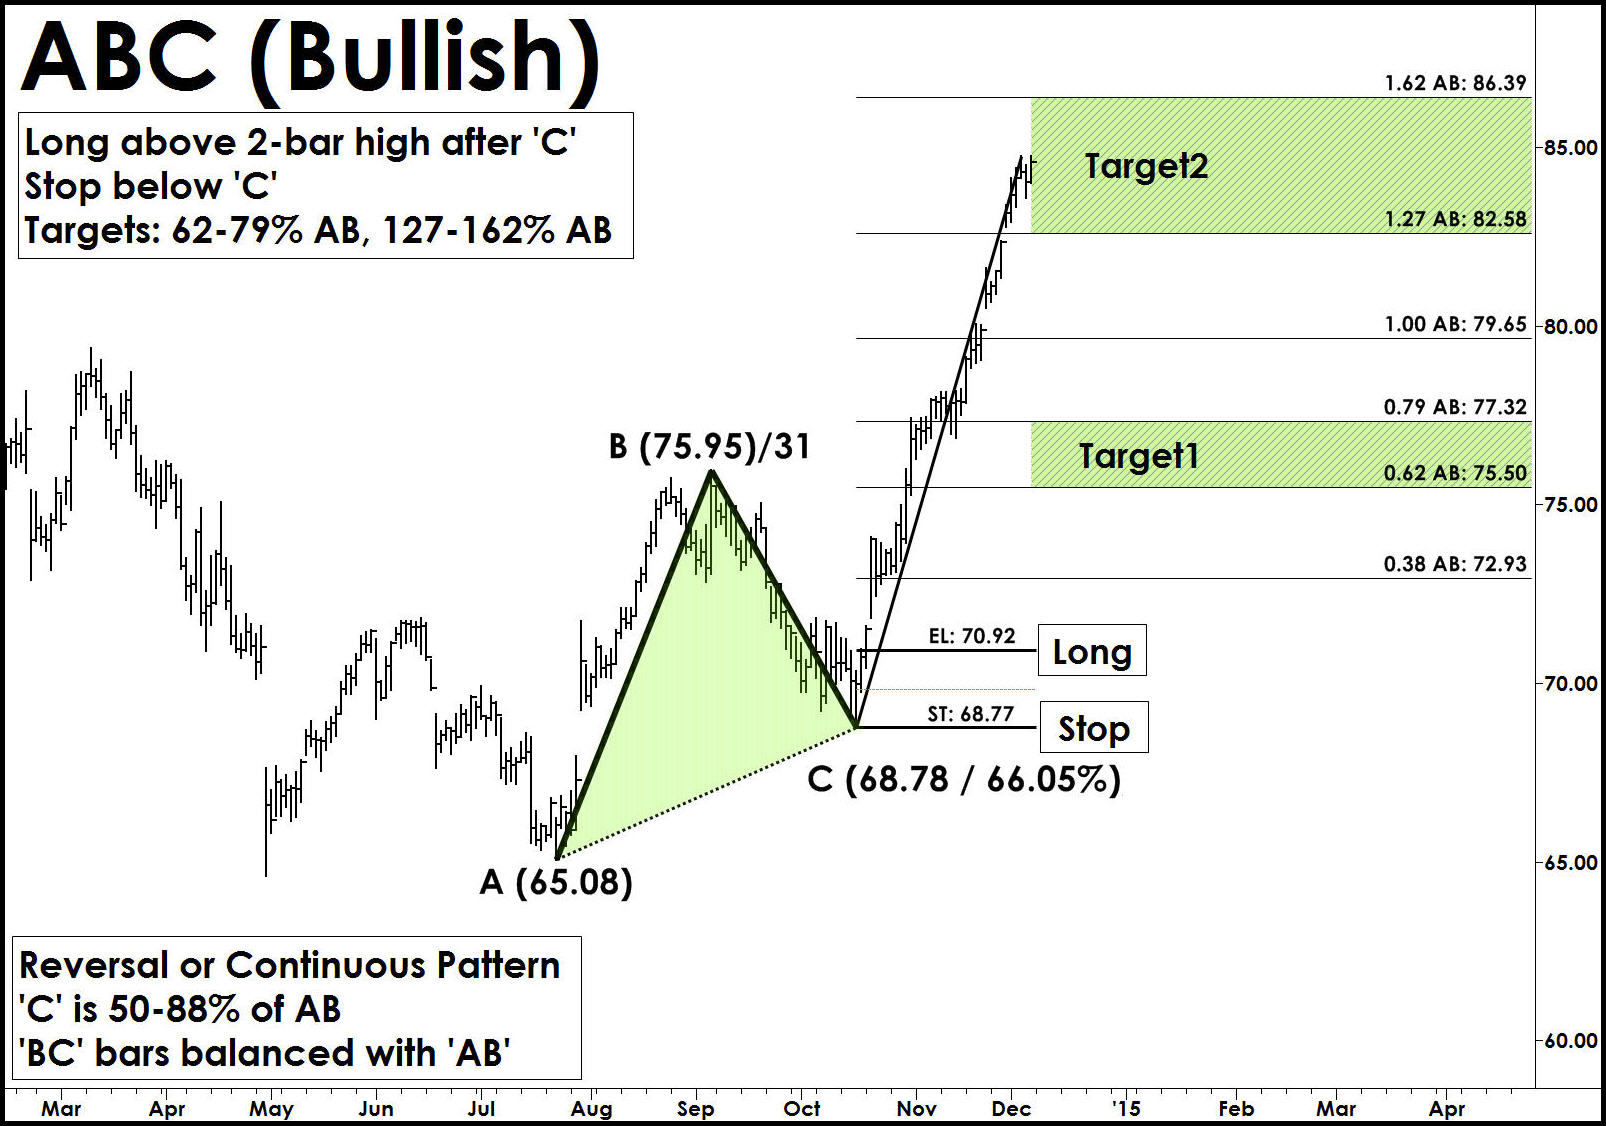
Trade Entry: After ABC pattern is completed, it is advisable to wait for the pattern to confirm a reversal signal using any momentum based indicator or price confirmation mechanisms. Enter after a long trade above the Entry Level ('EL').
Stop loss: A stop is placed few ticks below C (in Bullish) or few ticks above C (in Bearish) levels.
Targets: The ABC Pattern targets are computed using the AB and BC swings. The height pattern (AB) is used to project target levels from C-level using Fibonacci ratios. The first target zone is (62%-79% AB) from 'C' and second target zone is (127%162% AB). A secondary target level is set at 100% AB Level.
Examples of ABC Bullish Patterns
The following charts show the ABC Bullish pattern formation in oil drilling stocks. Most patterns require underlying trends to confirm to trade them. None of these stocks have trend confirmations to truly signal the long price entries into stocks.
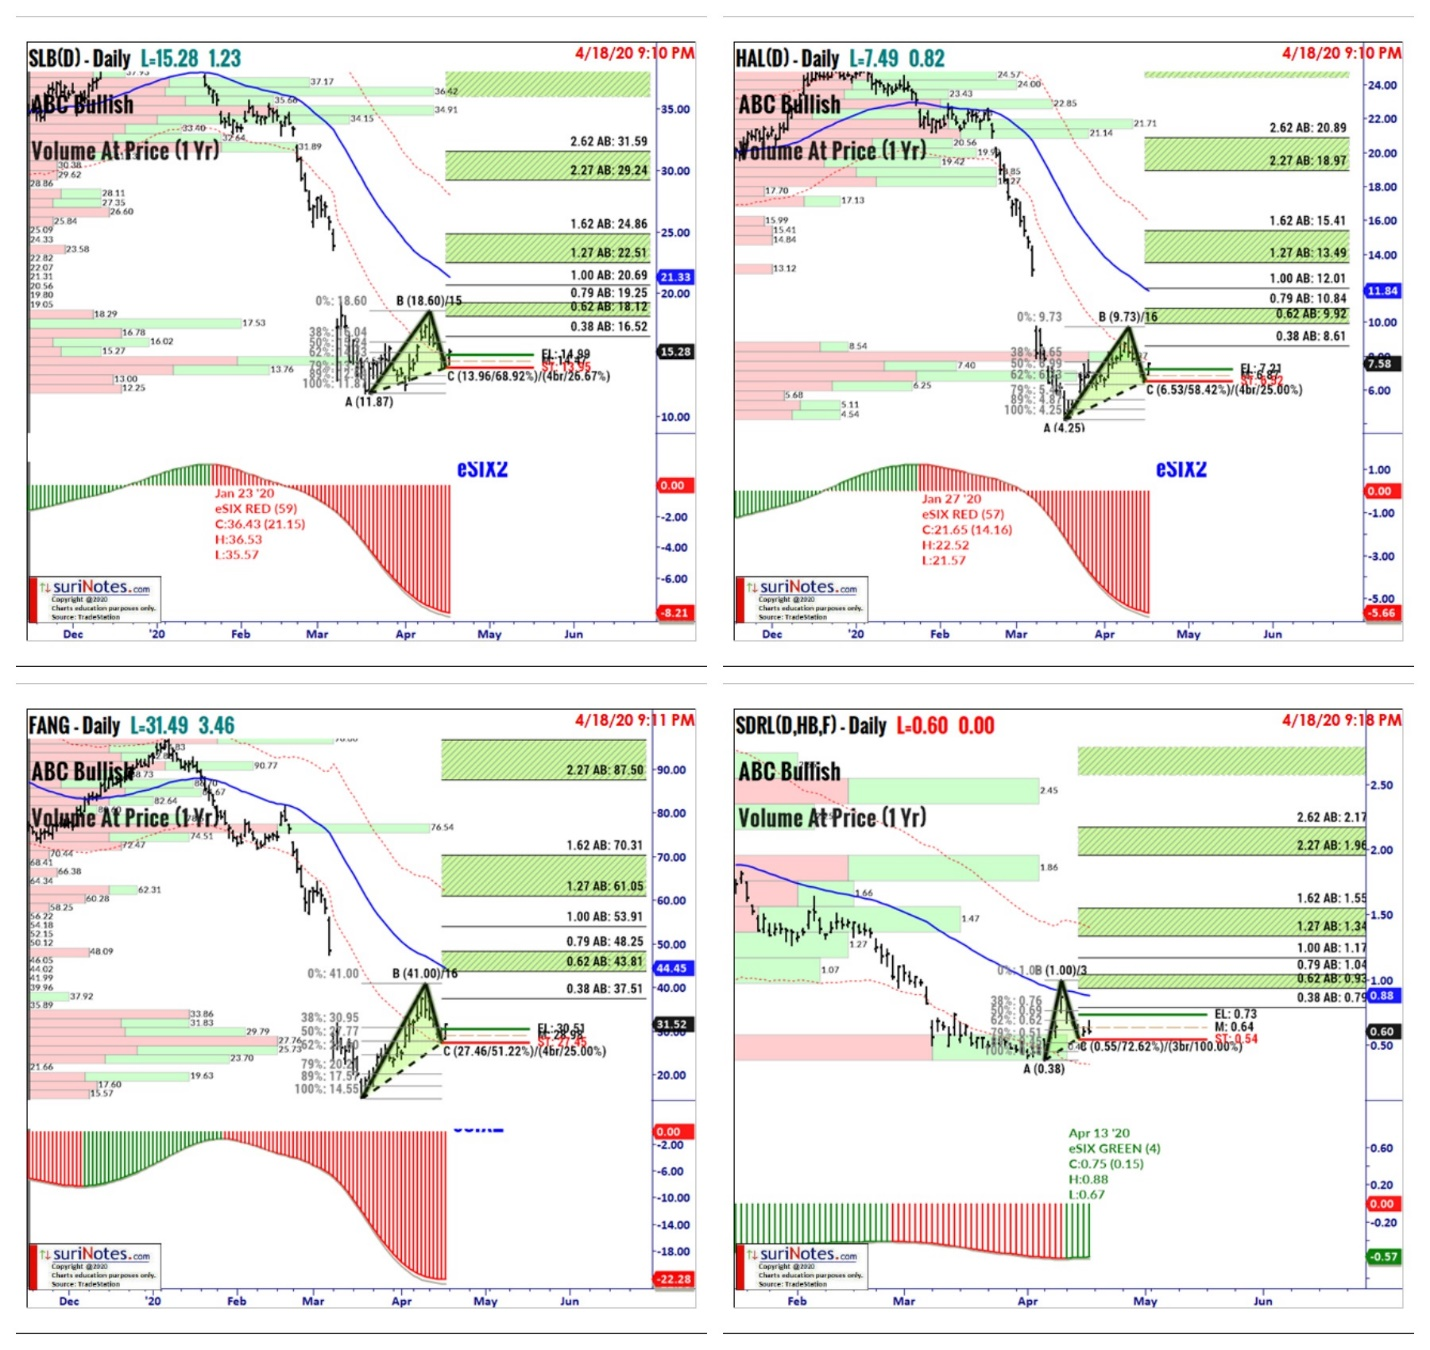
Seadrill Ltd. (SDRL) is trading in ABC Bullish Pattern from a low of 38¢ to $1.78 with a retracement of 72.62%. If prices close above 73¢, a long trade may be entered with a stop below 54¢, and targets are set at 90¢ and $1.30 to $1.60.
Schlumberger Ltd. (SLB) is trading in ABC Bullish Pattern from a low of $11.87 to $18.60 with a retracement of 68.92%. If prices close above $14.99, a long trade may be entered with a stop below $13.95 (-1.04), and targets are set 18.1 to 19.2 and $22.5 to $24.9
Halliburton Co. (HAL) is trading in ABC Bullish Pattern from a low of $4.25 to $9.73 with a retracement of 58.42%. If prices close above $7.23, a long trade may be entered with a stop below $6.53 (-0.69), and targets are set 9.9 to 10.8 and $13.5 to $15.4
Diamondback Energy (FANG) is trading in ABC Bullish Pattern from a low of $14.55 to $41 with a retracement of 51.22%. If price closes above $30.51, a long trade may be entered with a stop below $27.45, and targets are set $43.80 to $48.20 and $61.10 to $70.30.
Find more of Suri’s work at surinotes.com.


