

The double top in the euro indicates weakness, but longer term it could breakout in either direction, writes Al Brooks.
The EURUSD currency pair has traded sideways for four weeks. It is in Breakout Mode. Traders are looking for small reversals until there is a strong breakout.
The EURUSD weekly chart has been in a tight trading range for five weeks (see below). It is nested within a nine-month trading range. Traders are continuing to look for reversals.
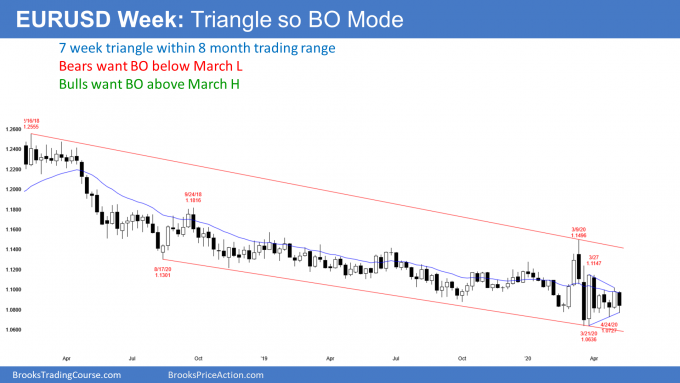
It is now in the bottom half of the range. There will probably be a bounce for a few days this week. With the range as tight as it has been, the legs up and down are lasting only a week. For the past two years, legs up and down went two to four weeks before reversing.
The weekly chart is in Breakout Mode. It is reasonable to call it a seven-week triangle. When any market is in Breakout Mode, there is always both a reasonable buy and sell setup. Here, the bears have a double top with the April 15 and May 1 highs. There is a head and shoulders bottom on the daily chart (not shown) that began with the April 6 low. Since most breakout attempts fail, the buy and sell patterns keep failing and new ones replace the old ones.
A clear breakout means consecutive closes beyond the range. The breakout is more likely to be successful if there are consecutive big trend bars closing on the extreme. This is true for both bull and bear breakouts. Without that, traders will expect every breakout attempt to reverse.
Monthly chart in two-year bear channel
While the weekly chart is in a nested trading range, the monthly chart has been in a bear channel for two years (see below). March was a big outside candlestick and April was an inside bar. This is an inside-outside-inside (IOI) pattern. Since that is a Breakout Mode pattern, April is both a buy and sell signal bar.
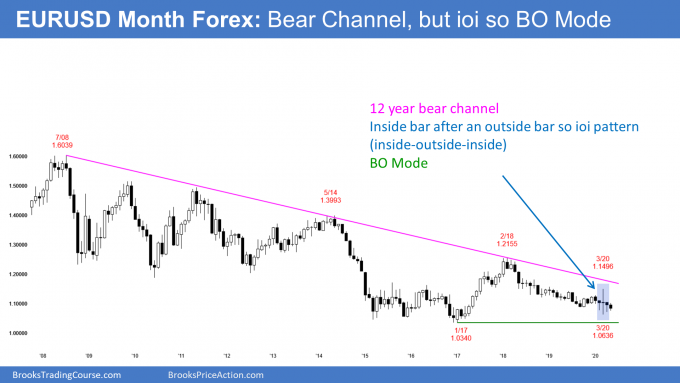
All three bars in the IOI had bear bodies and the bear channel is holding below the 20-month exponential moving average. This makes a bear breakout slightly more likely than a bull breakout. But with the past three months all having prominent tails below, this is a weak sell setup. There is a 50% chance that there will be more buyers than sellers below April’s low.
The bears want the bear channel to continue to below the January 2017 low. That was the start of a strong yearlong rally and it is therefore support. They then want the EURUSD to continue down to par (1.0).
The EURUSD should continue at least a little lower because there is no sign of a bottom. But because it is just above support, traders will buy if there is a strong reversal up on the monthly chart.
Trading Room
Traders can see the end of the day bar-by-bar price action report by signing up for free at BrooksPriceAction.com. I talk about the detailed E-mini price action real-time throughout the day in the BrooksPriceAction.com trading room. We offer a two-day free trial.


