

As bearish voices intensified during Asia and the early Thursday morning U.S. session, Head and Shoulder formation enthusiasts flexed their muscle regarding the major U.S. and European stock indices until the indices snapped right back.
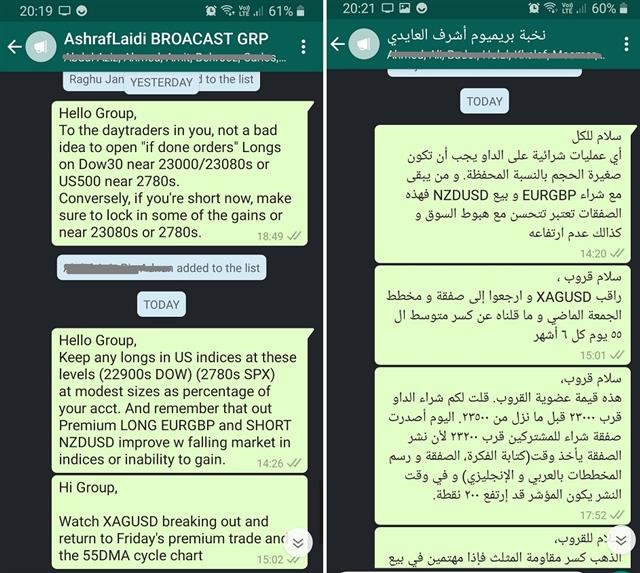
We mentioned on Tuesday to our VIP subscribers via WhatsApp Broadcast Group (See snapshots below) that Dow Jones Index would extend losses from 23700 to 23000, at which time would be a decent buying opportunity for short-term traders.
It is one thing to give an idea and another thing is to back it up with facts. The charts below combine the intermarket view alongside equity rotation, metals' technical analysis to make the case for short-term bounce in risk (indices).
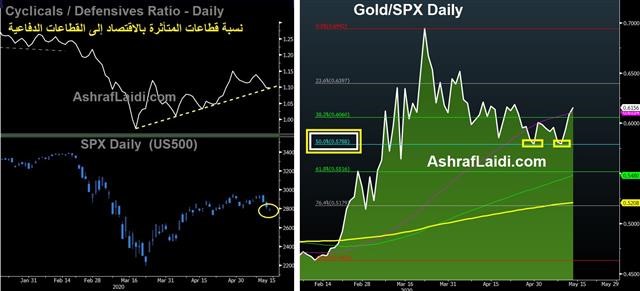
The first chart highlights the ongoing uptrend in the Cyclicals/Defensives sector ratio, which not only bottomed three days before the SPX, but continued to rest on a perfect trendline support since.
andlestick analysis enthusiasts have the potential doji on dailies as well as persistent horizontal base support.
Finally, the chart on the right-hand side answers the question, “Why is gold is not falling as stocks selloff like it did this year?” As the Gold/SPX charts rebounds off key support, it highlights further gold outperformance relative to stock indices, which is only a sign of improved risk appetite (as well as increase probabilities of zero rates in the United States). This was useful about three hours earlier when the rebound in gold and silver during the stock index selloff suggested the weakness was not part of a panic that forced gold holders to sell their winners, but a harmless pullback/readjustment in stocks. For the bigger picture, being selectively long indices stock sectors is a long-term proposition worth your while.
Today, the silver/USD dollar pair (XAG/USD) further broke away from its 55-day moving average (like it does every five to six months for the past three years -- before accumulating further run-up.
That is what we call actionable Intermarket Analysis.
You can see Ashraf’s daily analysis at www.AshrafLaidi.com and sign up for the Premium Insights. Ashraf discussed Trends in Yield Differentials at the TradersEXPO New York on March 8.


