

As the EURUSD pair has been sideways for a year on its monthly chart, Al Brooks looks at technical patterns in the euro currency.
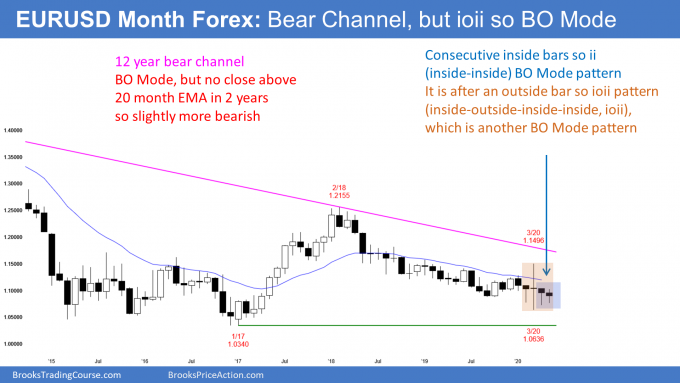
The EURUSD currency pair has an inside-outside-inside-inside (IOII) Breakout Mode pattern on its monthly chart. Since the euro has been unable to get above the 20-month exponential moving average for two years, there is a slightly higher probability of a bear breakout.
The EURUSD pair has been sideways for a year on its monthly chart (see below). The range in March was huge. Its high was the high of the prior 12 months and its low was the low of the prior 12 months.
April’s high was below the March high and its low was above the March low. April was therefore an inside bar.
Since March was an outside bar, February was inside of March. This is an inside-outside-inside (IOI) Breakout Mode pattern.
So far, May is within the April range, so there now consecutive inside bars, which is an inside-inside (II) Breakout Mode pattern. The entire four months is now IOII.
Breakout Mode patterns
In general, the chance of a bull breakout is the same as for a bear breakout. But there has been only one close above the 20-month moving average in two years. Therefore, even though the bear channel is almost flat, the bears have been consistently a little stronger. Consequently, there is a slightly greater probability of a bear breakout. If the bears get their breakout, traders will look for a test of par (1.0).
A Breakout Mode pattern is both a buy and sell signal. If May falls below April’s low, May would trigger a sell signal. If it goes above April’s high, it would trigger a buy signal. Sometimes it does both. Whichever it does more recently is the currently active signal.
What makes IOII Breakout Unreliable
There are problems with this setup. All four bars are dojis. That means there is no sustained energy. No one is strongly committed to a direction. Therefore, there will be no trapped traders who will be forced to exit in a panic if wrong. That reduces the probability that a breakout of April’s range will result in a trend.
Additionally, Breakout Mode patterns have a better chance of leading to a trend when they come at the end of a strong trend up or down. The current IOII is coming in the middle of a yearlong tight trading range.
Markets have inertia. They have a strong tendency to continue what they are currently doing. That increases the chance that there will be buyers below and sellers above, resulting in a continuation of the trading range.
Will a breakout lead to a trend?
If the breakout is strong, traders will look for a trend. For example, if June is a big bear trend bar closing on its low and far below the May low, traders would expect lower prices. The opposite is true of a strong bull breakout.
But look at the chart. Many bars went above or below the prior month’s range over the past two years. In every case, the breakout reversed within a couple months and the trading range continued. This is what is most likely here as well.
Markets do not stay in tight trading ranges forever. Traders know that there will be a successful breakout up or down at some point. With this trading range lasting as long as it has, the breakout will probably come this year. But until there is a clear, strong breakout, traders will continue to bet on reversals.
Trading Room
Traders can see the end of the day bar-by-bar price action report by signing up for free at BrooksPriceAction.com. I talk about the detailed E-mini price action real-time throughout the day in the BrooksPriceAction.com trading room. We offer a two-day free trial.


