

The current rally has been staged by retail traders, will they get burned, asks Joe Duarte.
Either institutional investors or the retail masses are going to face a serious market related decision in the next few weeks to months. History says that retail investors are being lured into a bull trap. Yet this is a market where the unthinkable is a daily occurrence, which means that history should not be ignored, but that it can and should be questioned.
As we hit the Memorial Day benchmark, the start of summer markets, investors should consider if the same old rules apply to the stock market in this post new normal environment. And here is why. Recent trading patterns and data suggest that the recent stock rally has been mostly due to an influx of money from retail investors; mostly young people using their online trading apps, and in many cases moving stimulus money into the stock market as institutional investors who initially panic sold in response to Covid-19 have stayed on the sidelines missing the rebound.
The big questions are: what happens if the individual retail investor is right? What if the worst is actually over? And what will happen to stock prices if institutional investors decide to play catch-up? By the same token, there is also the possibility that the old order will return and the recent rally fades leading to a resumption of the downtrend and yet another massacre of retail investors.
Is the Worst Really Over?
The gloom and doom is thick and for good reason as the uncertainty of the Covid-19 crisis, rising geopolitical tensions in Hong Kong, China and the Middle East, the looming presidential election and their potentially epic repercussions continue to affect the financial markets, economy and people’s lives (MEL) complex adaptive system.
By the time the U.S. market opens on Tuesday, due to the Memorial Day holiday, a lot can happen. Nevertheless, while there is plenty to worry about, there are also some encouraging signs that the system has begun to adapt to the Post New Normal reality.
What we are experiencing is a sort of rolling reality with new layers appearing on key central concepts over time. On May 17, I noted that the weekly jobless claims number would be a bellwether for the future. Specifically, I noted that a drop in this key statistic would likely be bullish for the economy as it would document any degree of people getting back to work that was appearing in the recent past.
And, while initially, the most recent number seemed to be another negative, there were some interesting statistical gymnastics that were highlighted in a more in depth analysis of the data along with recent polling results which suggest that we may be starting to see a bottom in job losses, which should translate to an improvement in jobless claims, perhaps as early as the next week or two.
Of course, it’s nearly impossible to know whether the worst is over; and things could change in an instant. But it’s also not out of the realm of plausibility that the situation may be improving.
The way MEL adjusts is just as important as what the virus does. Thus, if and as people find ways to return to work, the odds of improvement in the economy, although possibly regionally diverse are likely to increase. In fact, while statistics such as GDP and national employment statistics look at the macro situation, as this dynamic evolves, it will be paramount to look at regional data, with special attention to migration patterns from areas that are having more problems to areas where the virus has done less damage and where the economy has recovered and how that migration will affect the inner workings of MEL.
From Crisis to Transition
As MEL evolves, it’s important to change our investment focus to the type of stock that is working at the moment. This week I’m looking at a stock which is suddenly out of favor Campbell Soup (CPB), and contrasting it to one that is, homebuilder DR Horton (DHI).
Campbell was an early winner from Covid-19 as consumers where emptying out supermarket shelves of staples while DHI was taking it on the chin. More on this odd pairs trade in tomorrows report.
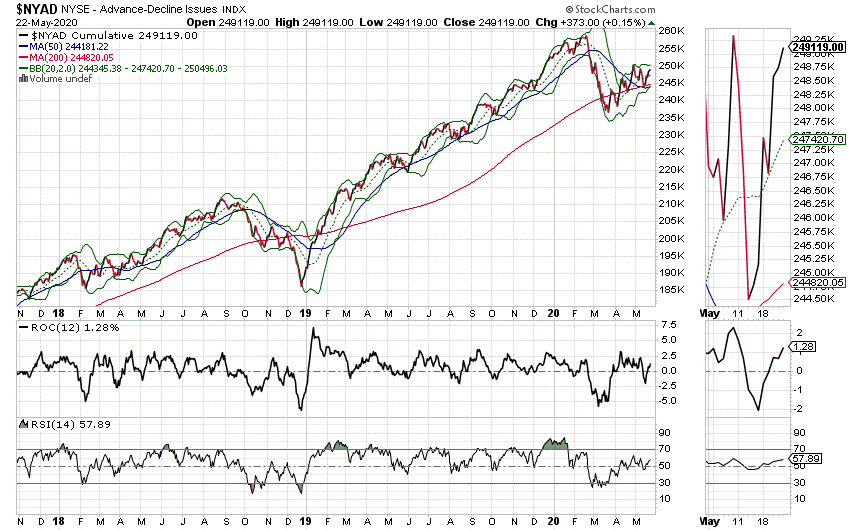
Market Breadth Remains Stuck in a Rut
The NYSE Advance Decline line is stuck in a rut between its 20-, 50- and 200-day moving averages providing support, and its recent high offering resistance. This technical posture clearly reflects the ambivalence of traders and the uncertainty of the moment and until this situation breaks one way or another, the uptrend remains vulnerable.
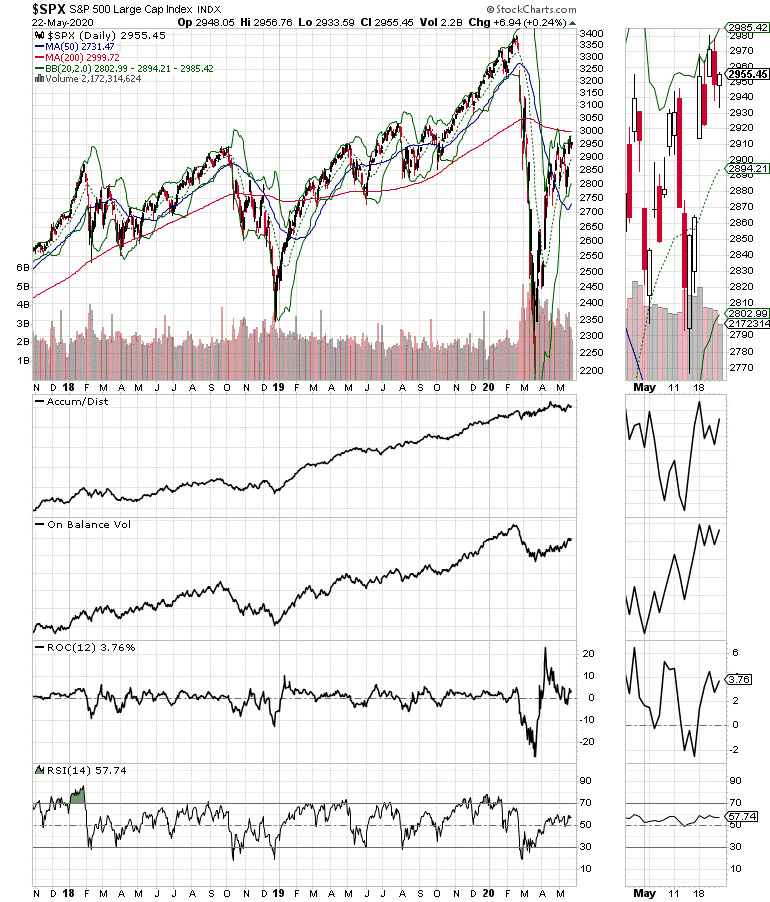
Meanwhile the S&P 500 (SPX) continues to struggle at the its 200-day moving average resistance near 3000. It remains above its 20- and 50-day moving averages (see chart).
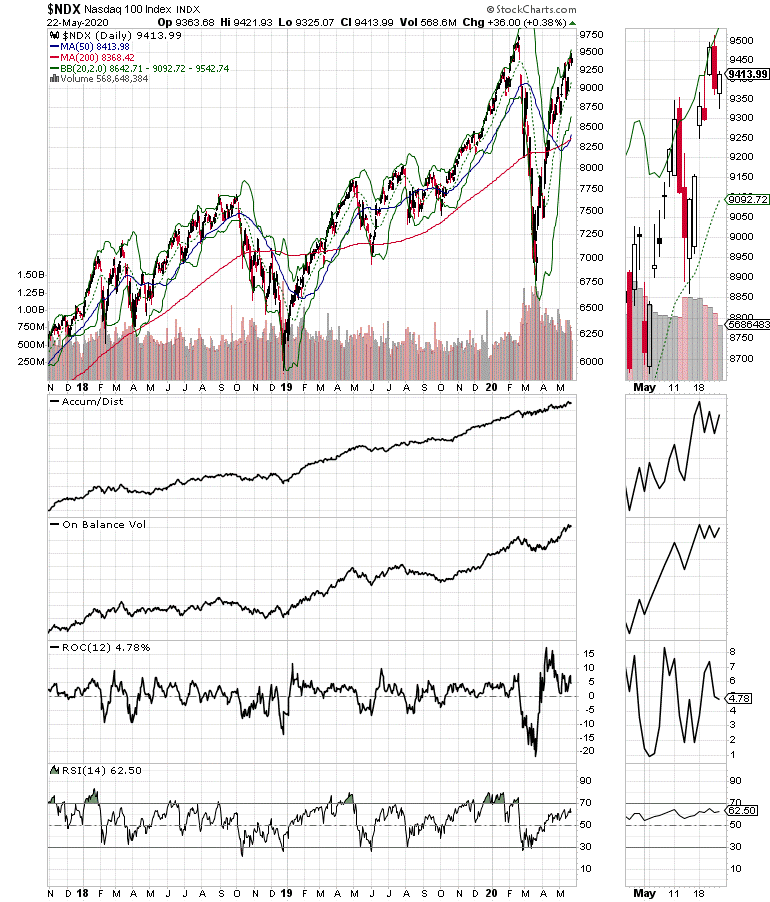
Elsewhere, the Nasdaq 100 (NDX) has a shelf of support between 9150 and 9300, but if the index fails to move above 9750, we may be looking at a double top (see chart).
From a technical standpoint, just as from a fundamental standpoint, the market is trying to decide its next course of action, just as we head into the traditionally slow summer trading season.
Who’s the Greater Fool?
The stock market could easily crash and burn tomorrow and the institutions could say “I told you so,” without any qualms. Yet, data suggests that a big change has taken place in the markets. And whether the data is believable or whether it holds up over time is as important as the data itself.
Nevertheless, the bottom line at the moment is that institutional traders are not their normal selves these days. By sitting out the recent rally, they will have to either stay out until the market falls again or play catch-up and buy stocks in order to keep their clients happy. If they do the latter, then the stock market will likely make significant gains as they pour money in as they fear missing out on whatever is left of the rally. If they don’t then things could get very interesting.
Meanwhile people who are out and about, and apply the old Peter Lynch “kick the tires” investment method, may see that the world is trying to bounce back and may be willing to take chances on the stocks of companies which seem to be doing business. This would be especially noticeable in the price of any stock if the institutions aren’t around to challenge their assumptions and actions.
What that means for traders and investors is that we continue to look for stocks with favorable chart patterns and solid fundamentals while as usual keeping an eye on the general trends of the market as we manage risk with position size, hedging as needed and periodic profit taking on those stocks which reach our price targets.
Finally, it’s important to recognize that the pendulum may be swinging, at least temporarily; that the world is truly changing. All of which means that we really are in uncharted waters now and those who adapt will survive while those who fail to recognize the evolutionary process that is taking shape are likely to be left behind.
I own DHI.
For an in depth look at how I analyze the markets check out my May 25, 2020 interview with Stockcharts.com’s David Keller on his show “Behind the Charts” on StockchartsTV. For air time and details click here. Joe Duarte is a former money manager, an active trader and a widely recognized independent stock market analyst since 1987. He is author of eight investment books, including the best sellingTrading Options for Dummies


