

The E-mini should test 3,100, but it is in the Sell Zone, writes Al Brooks.
In the next couple months, the E-mini S&P 500 will likely retrace about half of the two-month rally than break to a new all-time high.
The monthly E-mini S&P 500 futures chart had a big two-bar pullback in an 11-year bull trend in February and March (see chart). But a two-bar selloff is not enough to make a bear trend. April was a big bull bar closing near its high. It was therefore a High 1 bull flag buy signal bar.
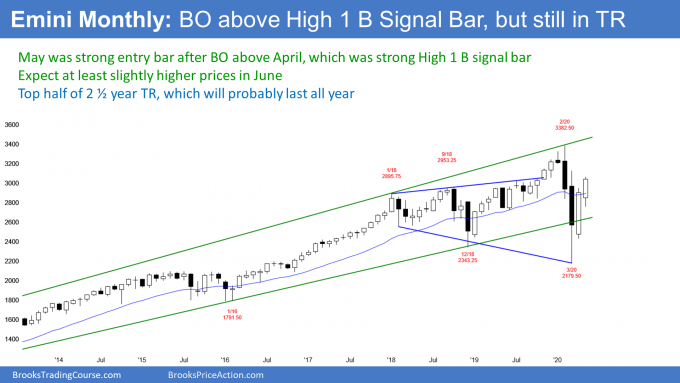
May triggered the buy signal by going above the April high. May had a good size body and it closed near its high. It was therefore a strong entry bar for the High 1 bull flag. A strong buy signal bar and a strong entry bar make higher prices likely.
Will this rally continue up to a new all-time high? February and March formed a huge selloff. A big Bear Surprise breakout has a 70% chance of at least a small second leg sideways to down. However, 20% of the time, the second leg does not begin until after there is a new high.
With April and May being very strong, there is now a 30% chance that the rally will continue up to a new high without another pullback on the monthly chart.
The weekly E-mini chart is still rallying in a V bottom reversal since March 23, But the rally changed its behavior six weeks ago (see chart).
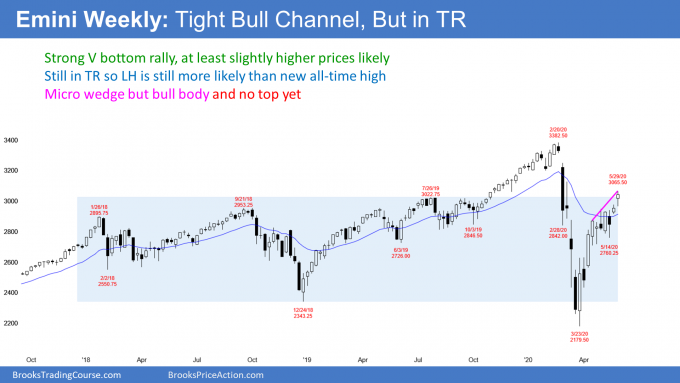
Prior to that, the bodies of the candlestick were big. However, once the E-mini reached the 20-week exponential moving average, the bodies shrank, and the tails became more prominent. That is a sign that the rally is losing momentum. It is the represents hesitation and more two-sided trading. That is the start of trading range price action.
Even though that rally has continued, that first doji candlestick six weeks ago is now a target. Once there is a selloff, traders should expect it to reach the bottom of that bar, which is around 2,700. There are reasons on the daily chart to expect the selloff to get to 2,600.
Bull leg in trading range leads to bear leg
The rally from that doji from six weeks ago is probably a bull leg in what will become a trading range. That means there will be a bear leg down to around the bottom of that bar. At that point, traders will say that the weekly chart is no longer in a bull trend and instead is in a trading range.
It is too early to know if this week is the end of the rally. As I discuss in the section below about the daily chart, there is an important magnet above 3,100 at the March 3 high. However, the rally is probably near the top of what will be a trading range for at least a couple months.
The daily E-mini chart rallied strongly last week (see chart below). It broke above the 200-day moving average. It also went above 3044.25, which is 10% down from the all-time high. As long as it is above 3044.25, it is no longer in correction territory.
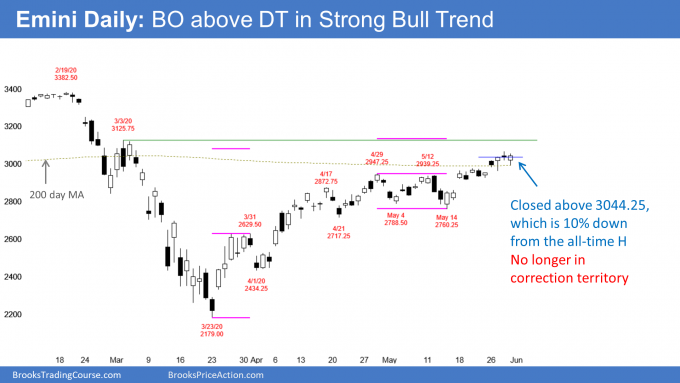
The next target is the one I’ve talked the most about since the March low. It is the March 3 high. That was the start of the March parabolic wedge sell climax. When a sell climax reverses, the rally usually tests the start of the sell climax. At that point, the bulls are usually exhausted, and the rally evolves into a trading range.
At the March 23 low, the odds were that the bulls would need two to three legs to reach it. However, the V bottom rally is getting there without more than a three-day pullback.
It does not have to reach it for traders to conclude the test is adequate. Also, it might go a little above it before reversing down.
But unless the bulls get a new all-time high, traders will call this rally either a leg in a 2.5-year trading range or a bear rally. Since it began, I have said that it is probably a leg in a trading range and that the trading range should last all year. That is still what is likely.
The sell zone is between 3,000 and 3,150
Most traders correctly believe that this rally is a strong leg in a trading range. They do not yet think it is a resumption of the 11-year bull trend. If it is part of a trading range, the two highest resistance levels are the 200-day moving average and the March 31 high. That means between 3,000 and 3,150.
This creates a favorable trade for the bears. If they sell in this zone and put a stop above the all-time high, they are risking 300 to 400 points. They expect a 50% pullback, which would be 400 to 500 points below their entry price. That means that their reward is greater than their risk.
The rally is still only a leg in a trading range. Therefore, the probability is that the E-mini will test 2600 before it reaches a new high. They therefore are more likely to make their reward than lose their risk.
Could last week be the high? While it’s possible, picking the exact top is a low probability undertaking. This is especially true in a strong bull trend with an important magnet above. That is why traders think more in terms of a zone. They expect that the first top will not be the final top. But they think the final top will not be much higher.
What happens in the Sell Zone?
It is an important level for strong bulls and bears. Both believed that the rally was going to be a bear leg in a trading range and not a resumption of the 11-year bull trend. The top of the trading range is a logical location for the bulls to take profits and the bears to sell.
But many strong bulls were surprised by how far up the rally went. Why haven’t other bulls taken profits and why haven’t the strong bears sold strongly?
The bulls are wondering if they can get a new high. They know that strong bears will be selling here and as the rally continues up to the old high. But if the bulls can get a new high, everyone will conclude that the bear case is not tenable. The E-mini would then be either in a trading range or a bull trend. Until then, it is still in trading range or a bear trend.
This price level is therefore a breakout zone. Will the strong bears win and create a 50% retracement, or will the strong bulls win and get a new high? Until there is a new high, the odds favor the bears.
Good risk/reward with good probability is unusual
It is fairly unusual to find a trade where both the risk/reward and the probability are on your side. Granted, neither is strongly on the side of the bears, but they both favor the shorts now that the E-mini is around 3,100. Consequently, it is reasonable for traders to consider shorting in this sell zone. The closer to the March high, the better the risk/reward.
The bulls understand the math. This area is a good level for them to take profits. They then can look to buy again between 2,600 and 2,700.
If they exit and the E-mini continues up to a new high, they can always buy at a new high if the breakout is strong.
When will the rally end?
The two-month rally is still probably just a strong bull leg in a trading range. Traders expect that there will eventually be a bear leg in the range before there is a new all-time high.
The rally is very strong. Traders will bet that reversals down will not get far or last long. Every selloff for two months has reversed back up within three days.
A bull trend often has to transition into a trading range before it reverses down. Therefore, even if this week is the end of the rally, the E-mini could go sideways for several weeks before clearly trending down. By the time traders conclude that the top is in, the selloff will probably be more than half over.
How far down will a reversal go?
When there is a reversal, the first target traders mention is a 50% pullback. That is currently around 2600.
Also, many institutions pay attention to the 50-, 100- and 200-day moving averages. The E-mini broke above the 200 day this week. Also, the 21.8$ and 61.2% Fibonacci levels. If it reverses down, traders will expect a test of the 50-day moving average. That is currently just below 2800.
Another target is the bottom of the most recent leg up. That is the May 14 low of 2760. It is at the bottom of a month-long trading range. That trading came late is a bull trend. It is therefore a potential Final Bull Flag. A reversal down from the breakout above a Final Bull Flag typically tests the bottom of the flag.
I mentioned that the E-mini closed above 3044.25 this week. That means it was no longer in correction territory, which is a selloff of 10% below the high.
Another important pullback is 20% down from the high. When the E-mini is below that, it is in a bear market. That price is 2706.00 and it is another magnet.
The March 31 high is a breakout point
When the market is in a trading range, the bull legs tend to go above support that seems too far to reach. The March 3 high is an example.
The bear legs often fall below support that is so far down that traders do not think it will get tested. The March 31 high is an example. The strong breakout in April was a break above that high. That is the breakout point.
There was a pullback on April 21 that did not get close to that support. There is now a gap below the April 21 low and above the March 31 high.
If a traders is looking for a support level that is much lower than what experts on TV are saying, that’s the one. Unless the E-mini breaks above the all-time high, there is a 60% chance that it will fall below 2629.50 before the end of the year. As I mentioned above, that 2600 is also a 50% pullback, which is common after a strong rally.
The E-mini could get there this summer. October is another month when there is often a surprisingly big selloff.
Trading Room
Traders can see the end of the day bar-by-bar price action report by signing up for free at BrooksPriceAction.com. I talk about the detailed E-mini price action real-time throughout the day in the BrooksPriceAction.com trading room. We offer a two-day free trial.


