

Trading is about risk management, Fawad Razaqzada shares an example in a recent profitable gold trade
Our recent gold trade recommendation is a good example of proper risk management. Here, we share before/after charts of the long gold trade we have been posting since Friday before the breakout, to give you an idea how to manage risk. Obviously, every trade is different, and not all work out the way we want them to. But what you can control, is your risk and ability to keep every losing trade to a minimum and every winning trade to a maximum.
The first key decision is the entry. If it doesn’t look good, my advice is always to forget it – there will be plenty of more opportunities and you should only focus on the best setups.
Once you have decided to enter a trade, and if the trade goes in your favor, adjusting the stop loss is then your main job. You are the risk manager. Your job is to reduce risk as much as possible, while still trying to make a profit.
Don’t just adjust the stop for the sake of doing so, only when it makes sense. This means moving it just below the most the next logical support level (in the case of a long trade, resistance level for a short trade).
In the case of gold, we adjusted it higher as soon as gold made a new high.
Here is how we traded gold
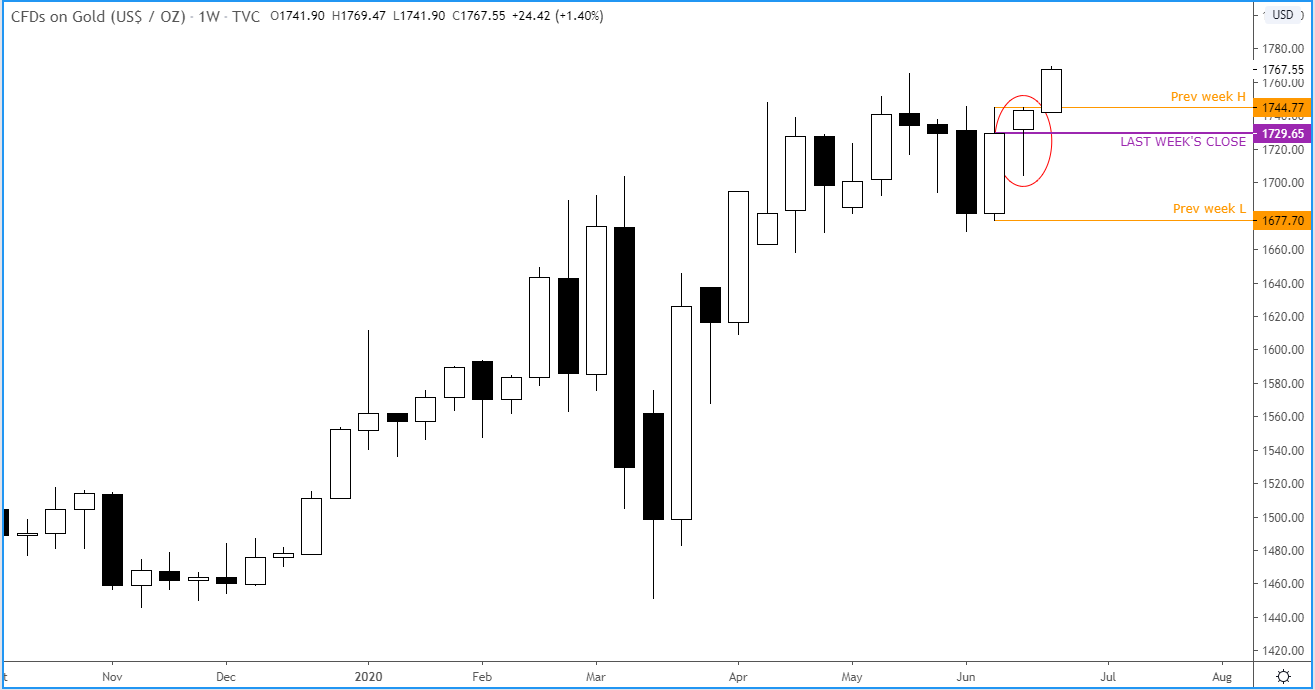
First, we identified the opportunity on the weekly chart on Friday, June 19, as gold turned positive after spending most of the week below the prior week’s close. The week prior, it had created a bullish-engulfing candle, so the bias on this time frame was already bullish. Here is how gold looked like on Friday when I posted the trade set-up.
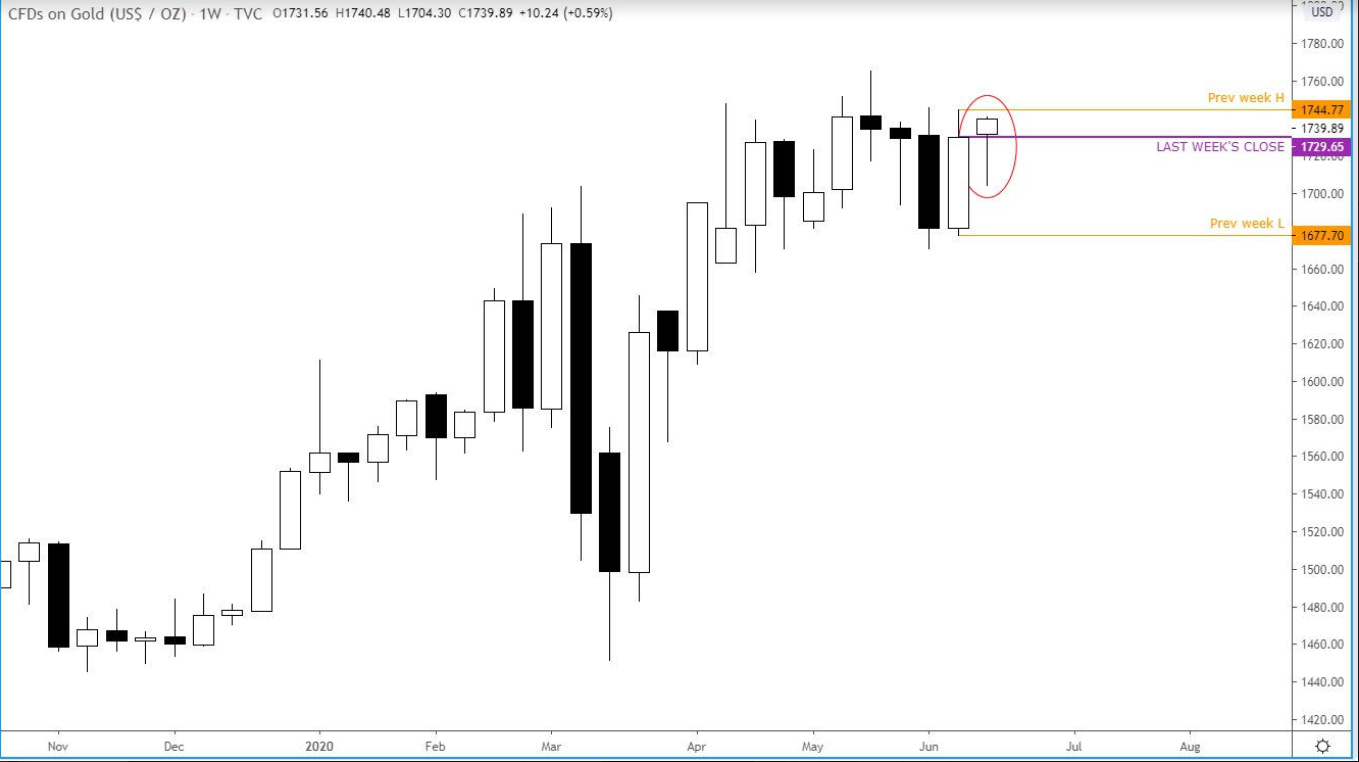
At the time, gold looked like THIS on the daily:
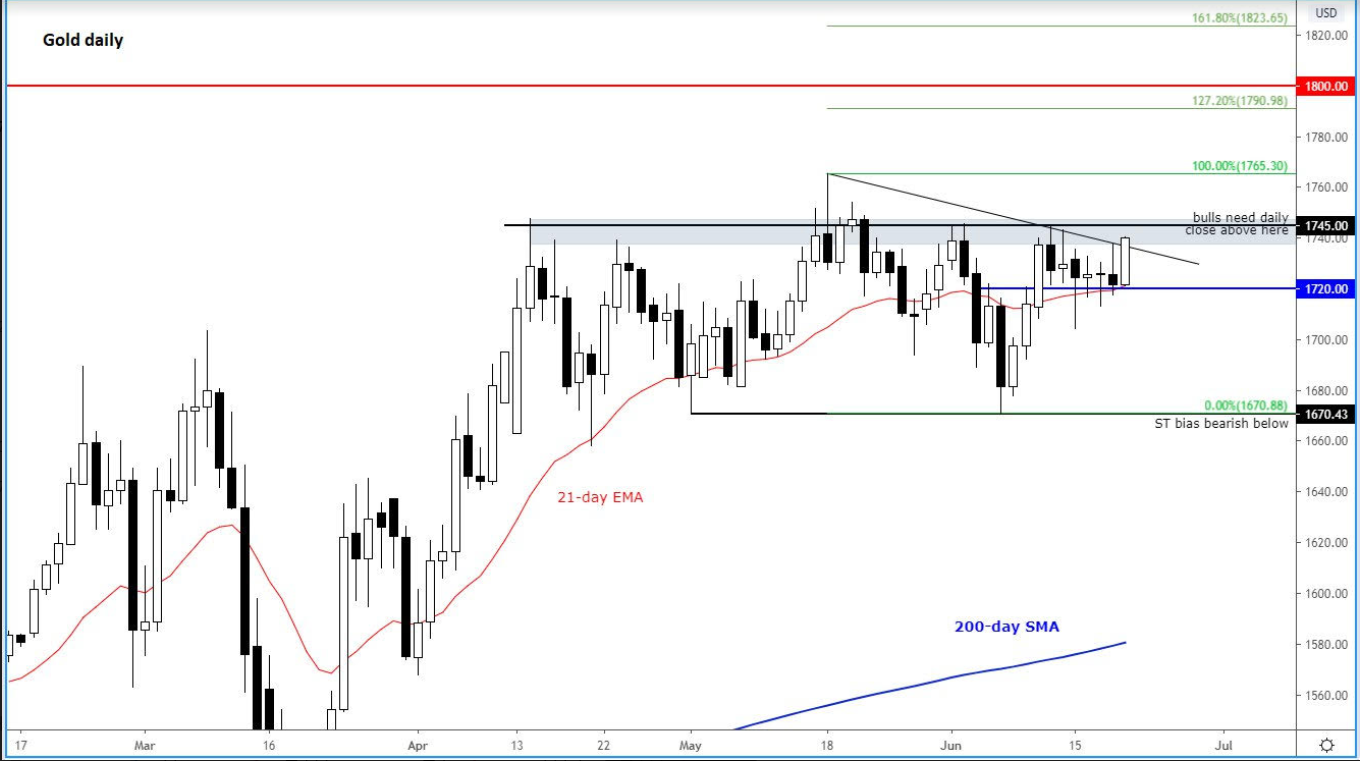
As gold had created an inverted hammer on Friday, it should have gone lower. Instead, support at $1,720 held, before gold broke out to the upside, taking out Thursday’s high.
At this point, we knew the bears were in trouble, so there was no need to wait for further confirmation to issue a trade signal, which we did on the hourly:At this point, we knew the bears were in trouble, so there was no need to wait for further confirmation to issue a trade signal, which we did on the hourly:
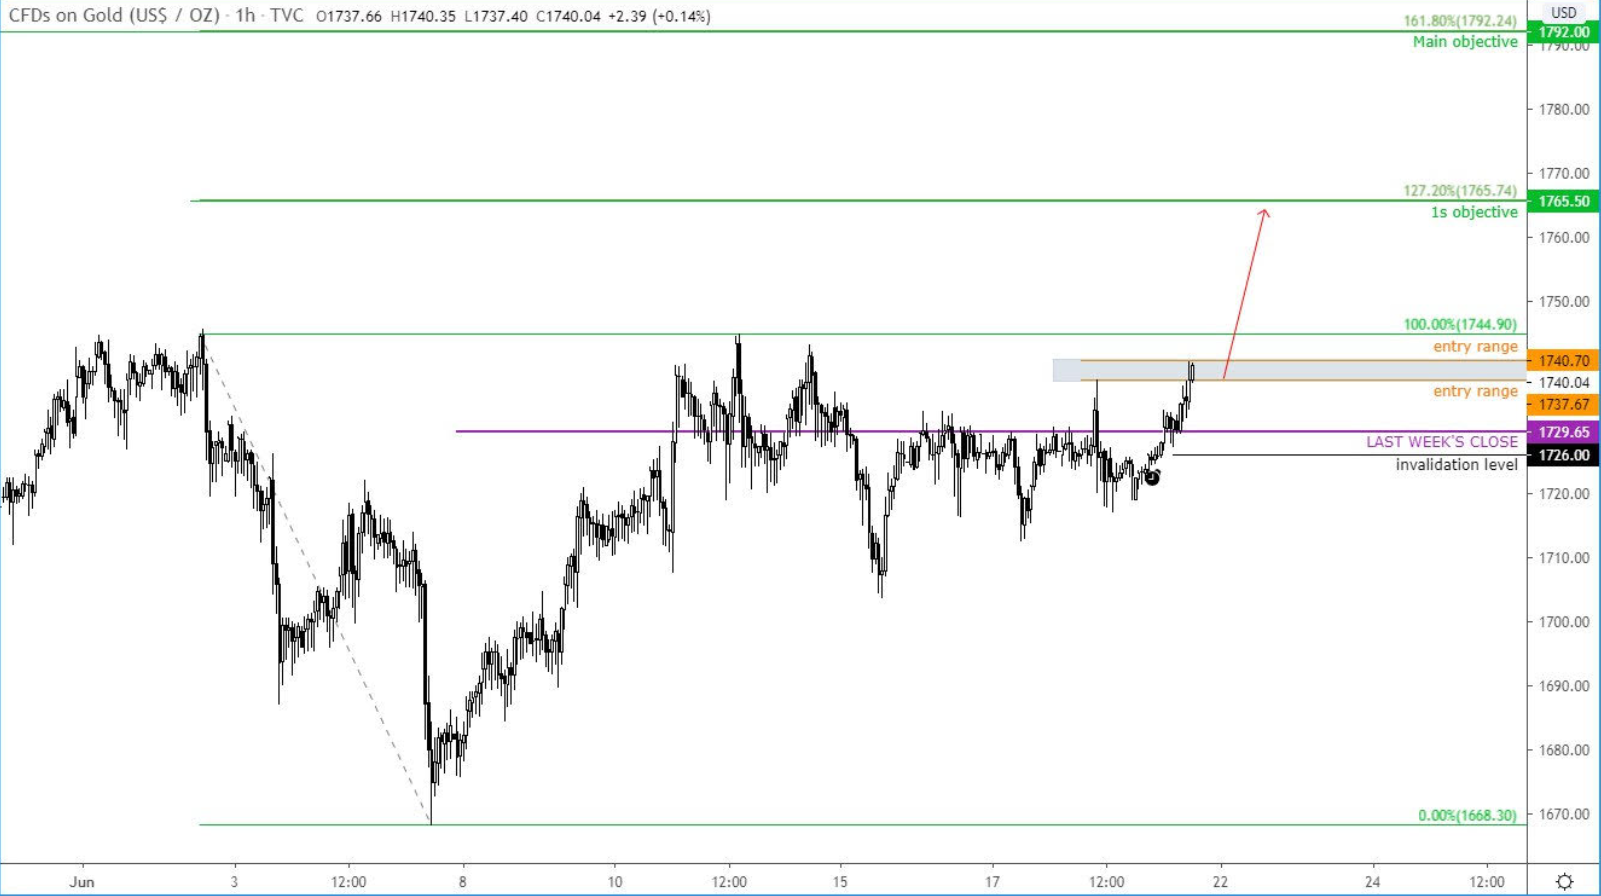
I didn’t want to see gold go back below the previous week’s close (or the current week’s open), so a good location to place the stop loss or invalidation level would have been below that, and we did so as per the chart above.
Once the trade triggered and the price started to move higher, we immediately raised the stop loss to reduce the risk:
On Monday gold broke out, as we had anticipated, prompting me to create THIS YouTube video:
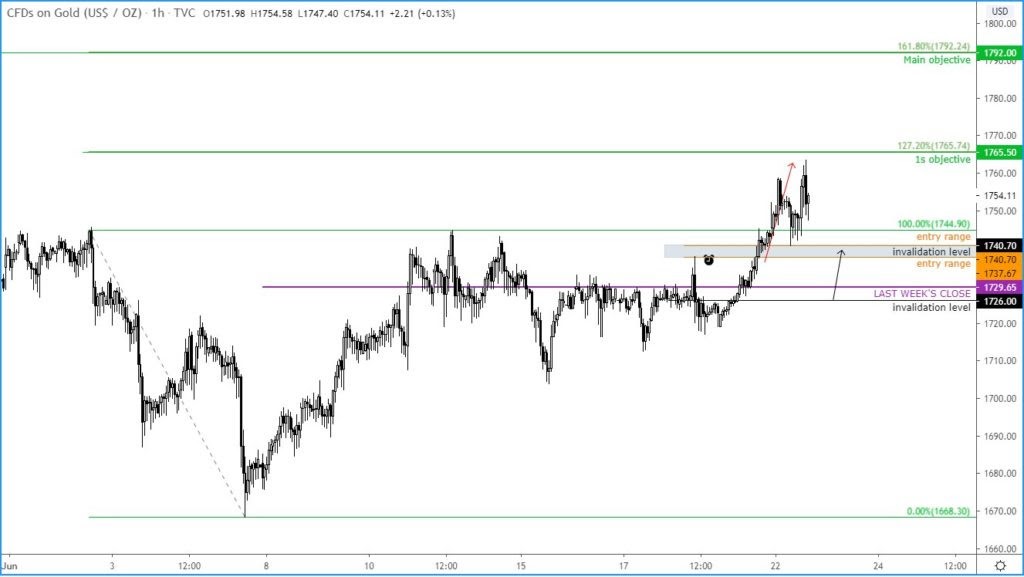
Tuesday, the first target was hit, so we raised the stop loss further to eliminate the risk completely on the remaining portion of the trade, which may or may not hit its intended target.
Finally, this is how gold was looking like on the week when this report was written:
Gold is looking very constructive from a technical point of view. But it needs to hold the breakout now and hold above $1,745 to maintain its bullish bias on this time frame.
Fawad Razaqzada, Senior Market Analyst at TradingCandles.com, is an experienced forex market analyst and economist. He posts market analysis on all sectors from both a technical and fundamental. Previously he served as a market analyst with FOREX.com and City Index.


