

Al Brooks provides trading set-ups in the E-mini S&P 500 after Friday broke above Thursday’s high and the week closed on its high.
This is the first time that the bulls have had consecutive bull bars on the weekly chart in five weeks. Traders expect at least slightly higher prices this week.
The bears want a double top with the June 5 high. If they get a reversal down this week, there would be a wedge rally with the June 19 and July 6 highs.
Many double tops have a wedge rally for the second leg up. But the bears will need a reversal down for a sell signal. The odds favor the bulls. June was a bull flag and the E-mini is now breaking above that flag.
The importance of the gap above the Feb. 24 high
For the past several months, I have been talking about the gap above the Feb. 24 high on the weekly chart. For the past month, the E-mini tried to reverse down from below the gap several times and failed.
Big weekly gaps are rare. That makes the gap an unusually important magnet. Once a market gets close to a strong magnet, it usually has to reach the target before traders will consider selling aggressively.
Consequently, traders should expect a move to above the 3238.25 Feb. 24 high within a week or two. At that point, traders will then decide if the E-mini will reverse down or continue up to a new high.
Possible island bottom on weekly chart
Last week gapped up, but the gap was small, and it quickly closed. Because last week closed on its high, there is an increased chance of a gap up this week as well. This is especially true with the strong magnet of the Feb. 24 high just slightly above.
If there is a gap up, there will be a four-month island bottom on the weekly chart. While island tops and bottoms are minor patterns, they are still signs of strength. The bulls will try to keep the gap open so that more traders will buy, expecting a new all-time high.
What happens if today does not gap up? Traders still expect a test into that February gap. Therefore, the odds favor higher prices over the next couple weeks, whether or not today sells off.
When a market gets nears an important magnet, it often accelerates toward the magnet. Why would a bear sell now when he believes he will be able to sell higher at the magnet soon? That shortage of sellers can create a buy vacuum up to resistance.
Overnight E-mini Globex trading
The E-mini is up 20 points in the Globex session. This week will probably open above last week’s high. There will then be a four-month island bottom on the weekly chart.
Since this is the second consecutive attempt to create an island bottom on the weekly chart, there is a higher probability of success. With the gap only being about half of the average recent daily range and with it likely to remain open Monday, traders should expect either a bull trend or trading range day today.
Is Friday’s buy climax a problem for the bulls today? Usually, the day after a buy climax day enters a trading range for at least a couple hours, starting by the end of the second hour.
While that could happen today, there might be enough euphoria about the break above the July high to create another bull trend day today. Day traders should look for a bullish bias Monday, and possibly a reasonably strong bull trend day.
However, if the gap closes again like it did last Monday, day traders will expect a bear trend day.
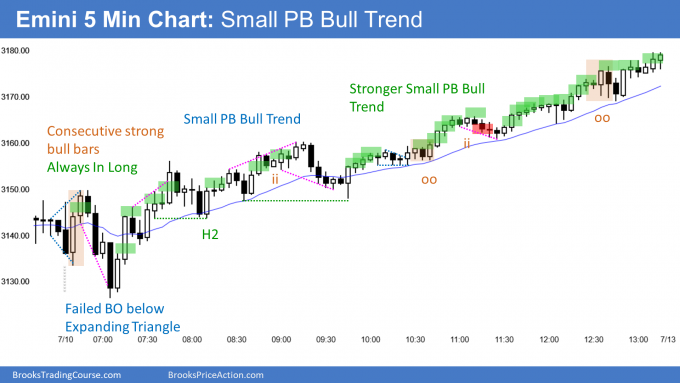
Friday’s setups
Here are several reasonable stop entry setups from Friday. I show each buy entry with a green rectangle and each sell entry with a red rectangle (see chart below). I also show limit order entries and entries on the close of bars. I do not want the lines to be distracting. If they are longer, I make them dotted. But they have to be visible, so I make the shorter ones solid.
My goal with these charts is to present an “Always In” perspective. If a trader was trying to be always in or nearly always in a position all day, and he was not currently in the market, these entries would be logical times for him to enter.
If the risk is too big for your account, you should wait for trades with less risk or trade an alternative market like the Micro E-mini.
Trading Room
Buyers of the Brooks Trading Course and Encyclopedia of Chart Patterns have access to a much more detailed explanation of the swing trades for each day (see Online Course/BTC Daily Setups).
Traders can see the end of the day bar-by-bar price action report by signing up for free at BrooksPriceAction.com. I talk about the detailed E-mini price action real-time throughout the day in the BrooksPriceAction.com trading room. We offer a two-day free trial.


