

Al Brooks breaks down the technicals in the long bond.
U.S. 30-year Treasury bond futures have been in a tight trading range for four months after reversing down in March from the most extreme buy climax in history. Bonds have been drifting up, but they will probably stay in a range for the rest of the year.
The 30-year T-bond futures has rallied over the past seven weeks (see chart). The bulls hope that this is a resumption of the 2020 bull trend. But so far, the rally does not have consecutive big bull bars closing on their highs. It looks like a leg in the four-month trading range and it is now simply testing the top of the range.
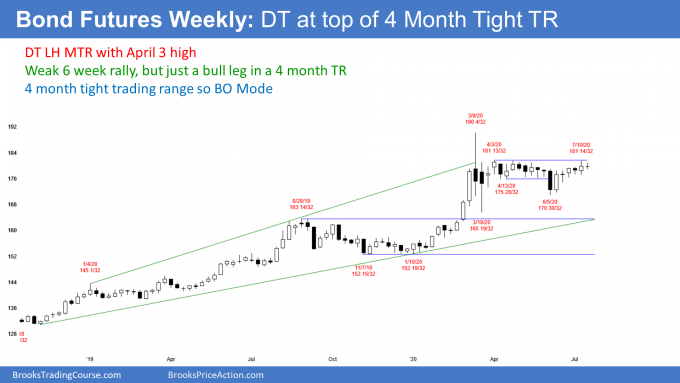
The bulls need a couple big bull bars closing on their highs to convince traders that the bull trend is resuming. There is currently a 60% chance that it is not, at least not yet.
4 month tight trading range on the monthly chart
It is important to understand that the January to March rally was the most extreme buy climax on the monthly chart in the history of the bond market (see below). The huge reversal down in late March is a sign that the bulls aggressively took profits.
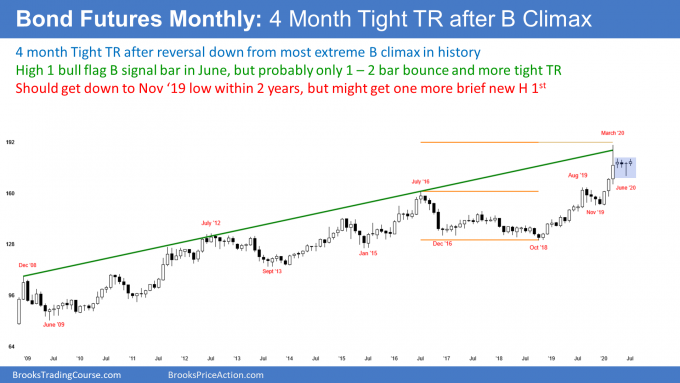
When there is an extreme profit-taking selloff after an extreme buy climax, traders are confused. Will the bulls buy again, creating a resumption of the bull trend, or has the bull trend ended? No one knows.
However, traders believe that the bulls are exhausted. Exhausted bulls like to see the bears make a couple credible attempts to create a bear trend before thinking about buying again. These two legs down typically take about 10 bars, which is around a year on the monthly chart. Therefore, the bond market will probably be sideways for the remainder of the year.
What happens after a year of sideways trading?
What happens after a year of two legs of sideways to down trading? Traders will decide if the two legs down are the start of a bigger move down or simply a bull flag.
If the selloff does not look particularly strong, the bulls will buy again. But even if they get a new all-time high, it will probably be small and brief. I doubt America will tolerate negative interest rates and that will keep a cap on bond prices.
Also, if there is a new high, it would be the third leg up from the 2018 low. Furthermore, the three-year bull channel has been tight. Consequently, traders will then expect a reversal down from a parabolic wedge buy climax.
What if March was the end of a 30-year bull trend? The first target for the bears is the bottom of the most recent buy climax. That is the January low. Since that is far below the current price and the bond market now has small bars, the bears will probably need a year to get there.
Below that is the bottom of the 2014 to 2018 trading range. A trading range late in a bull trend is often the Final Bull Flag. Its low is a magnet once there is a reversal down. If the selloff to the January low continues down, the next target is the 2018 low. Because that is far below the current price, the bond market would probably need two to three years to get there.
Trading Room
Traders can see the end of the day bar-by-bar price action report by signing up for free at BrooksPriceAction.com. I talk about the detailed E-mini price action real-time throughout the day in the BrooksPriceAction.com trading room. We offer a two-day free trial.


