

The euro has busted through its two-year bear channel but now faces a double top resistance, reports Al Brooks.
The EURUSD currency pair has had its strongest three-week rally in eight years. It is overbought on the daily chart and at the resistance of the September 2018 high. There is a nested wedge buy climax on the daily chart. Traders expect a pullback lasting at least two weeks and falling at least 200 pips.
The weekly chart of the EURUSD pair formed its third consecutive big bull bar last week (see below). This is the strongest three-week rally on the weekly chart since 2012.
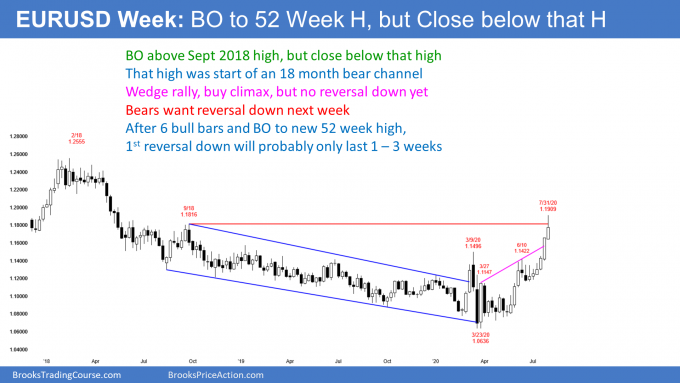
For over a year, I have been saying that the September 2018 high was a magnet and therefore resistance. That was the start of the two-year bear channel that began after the spike down in early 2018.
When there is a break above a bear channel, the rally usually tests the start of the channel. That is what is happening now with the test of the September 2018 high. The chart then often converts into a trading range.
But with this three-week rally as strong as it has been, the downside risk is small over the next couple of weeks. The bears will need at least a micro-double top before there is more than a one- to two-week pullback. A micro double top typically takes at least two to three bars (weeks) to form. Therefore, the EURUSD will probably be sideways this week.
Wedge rally to a double top could lead to a deeper selloff
The first reversal down might only last a couple weeks. But if there is then a brief rally back up to test the September 2018 high again, there would be a potential micro double top with last week’s high.
It is important to look at the entire chart. Remember, the three legs up from the March low is a wedge rally. That is a type of buy climax. It is testing the important September 2018 high. There is therefore the potential for a big double top.
The second leg up in a double top often is a wedge. That increases the chance of a reversal. A reversal down from a wedge often has about half as many bars as there were in the wedge. Although the first leg down might only be a couple weeks, there is a 40% chance that the EURUSD will soon begin a two-month swing down.
If it does, it will probably fall below breakout points. Those are the March 9 and the June 10 highs. It could also drop down to the bottom of the most recent buy climax within a couple months. That is the June 19 low of 1.1168.
Traders will know within a few weeks if the EURUSD will simply pause and then continue up or begin a test down to the breakout points. As strong as the three-week rally has been, traders should expect the EURUSD to be lower a month or two from now.
Next target for the bulls is the 2018 high around 1.25
Can the rally continue up to test the 2018 high? It might next year, but the current rally is so extreme that it will attract profit takers within a few weeks. That should result in at least a one- to two-week initial pullback of about 200 pips. The pullback will probably start this week. However, after such a strong rally, traders will buy the pullback. As I said above, if there is then a second reversal down, the selloff could be deeper and last longer.
Bulls need follow-through buying in August
July was a big bull trend bar on the monthly chart (see below). It broke above a two-year bear channel. When there is a breakout, traders want confirmation. The bulls want August to have a bull body on the monthly chart. If it does, that would increase the chance of higher prices in September.
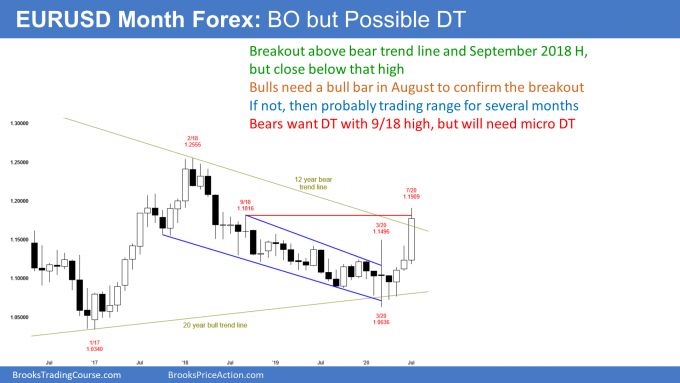
But if August closes near its low, then September will probably trade below the August low. The monthly chart might then evolve into a trading range for many months. That is what typically happens when there is a breakout above a bear channel.
If August closes somewhere in the middle of its range with either a small bull or bear body, traders will still expect at least slightly higher prices later in the year, but not necessarily in September.
The EURUSD daily chart has had a climactic rally for several weeks (see below). It has had at least three small thrusts up and it is in a tight bull channel. This is a parabolic wedge buy climax.
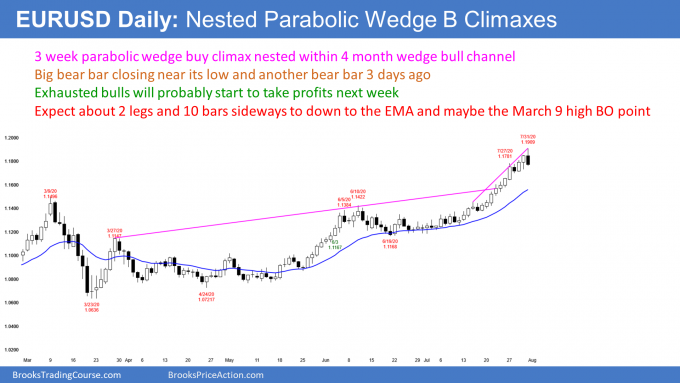
It is nested within a four-month wedge bull channel. A nested wedge is more likely to attract profit taking.
Friday was a big bear reversal bar and it closed near its low. It is a sell signal bar for a blow-off top. Also, the bear bar from three days ago was a prior attempt to reverse. This current second attempt therefore has a higher probability.
After an exhaustive buy climax, traders expect about 10 bars and two legs sideways to down before the bulls will buy aggressively again. A minimum pullback should be at least 2%, which is about 200 pips. It usually gets near the 20-day exponential moving average. However, as I said above, the selloff could continue down over a couple months to the March 9 and June 10 highs.
Trading Room
Traders can see the end of the day bar-by-bar price action report by signing up for free at BrooksPriceAction.com. I talk about the detailed E-mini price action real-time throughout the day in the BrooksPriceAction.com trading room. We offer a two-day free trial.


