

In this final installment on building a trade, Fawad Razaqzada describes recent trade set-ups in the British pound, Brent crude and gold.
Yesterday we described a couple of recent trade set-up in natural gas as well as one in the U.S. Dollar/Canadian dollar pair. Here, we show how we applied our approach to other markets this summer.
My intention is to provide you some ideas about how to look for trades, manage the risk while in a trade and how to exit. July and August offered many opportunities.
Example: GBP/USD (Aug. 5, 2020)
The British pound (GBP/USD) was in a strong up trend in early August and appeared to have taken out resistance. This is the idea I shared in the group on August 5:
GBPUSD long trade idea straight off the daily chart. The trend is bullish, and we are going with the trend. The GBPUSD spent the last 3 days pulling back only a little bit from the high, suggesting the bull trend remains strong. The day before, it created a hammer-like candle and today poked above it. So, the idea here is to go along with the invalidation being the low of the day before. We are targeting the liquidity above the old highs. Our first target is the high above 1.32 then subsequent target is the 1.33 handle. If/when the first objective is hit make sure to move stop above entry to lock in some profit for the remainder of the trade.
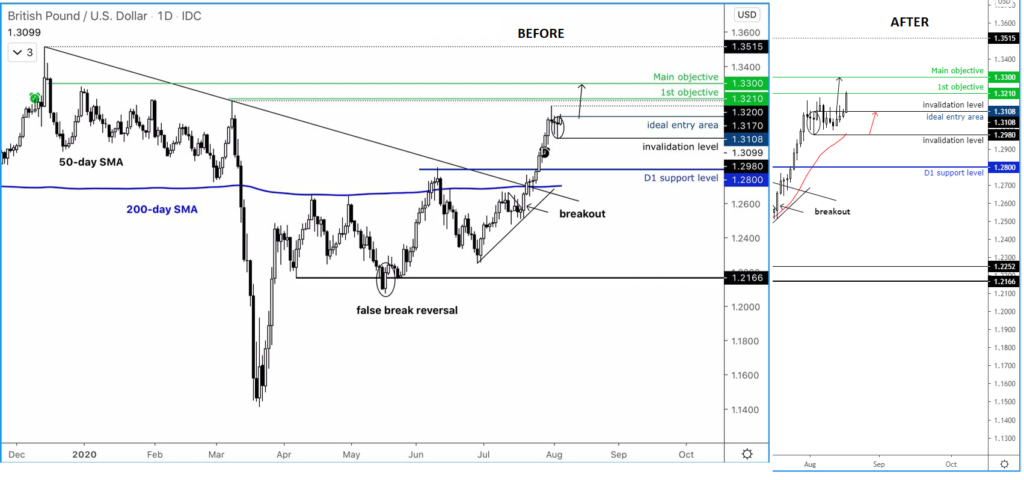
The GBP/USD took its sweet time but eventually hit the target on Aug. 18 (see chart above). Sometimes the markets move to your target or stop loss immediately, sometimes they take time. Trading is not like you put ‘X’ amount of effort and you should be rewarded ‘Y’ at ‘Z’.
We also had a few trades that didn’t work out, and here are a couple of examples:
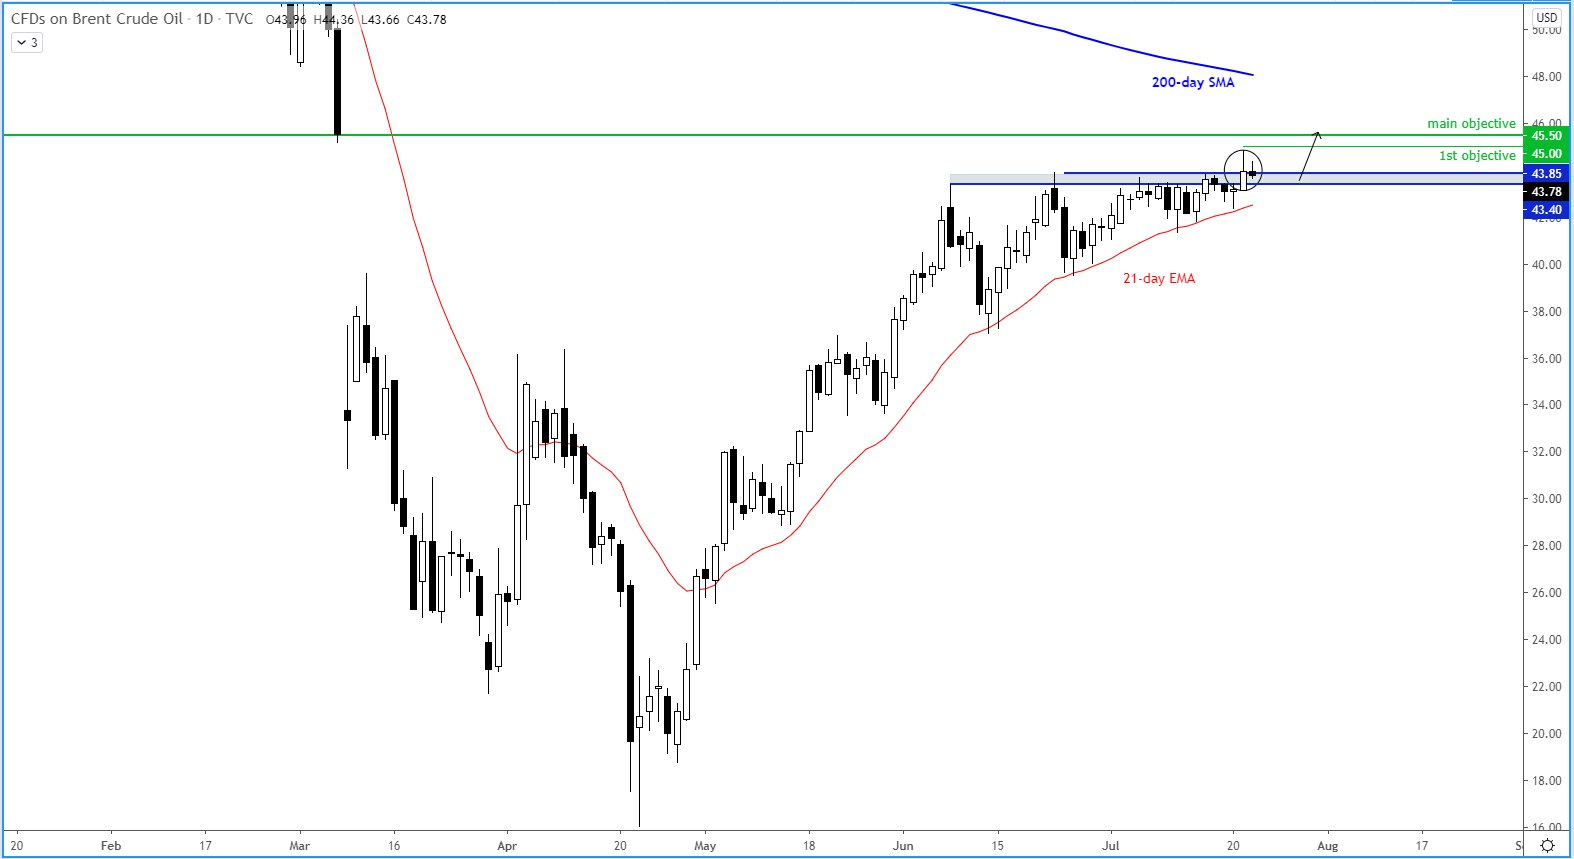
Example: Brent crude oil (July 22, 2020):
Following a successful trade on Brent earlier in the month, I was looking to get long again after prices retreated to this daily support area (see chart).
Source: TradingCandles.com and TradingView.com
Source: TradingCandles.com and TradingView.com
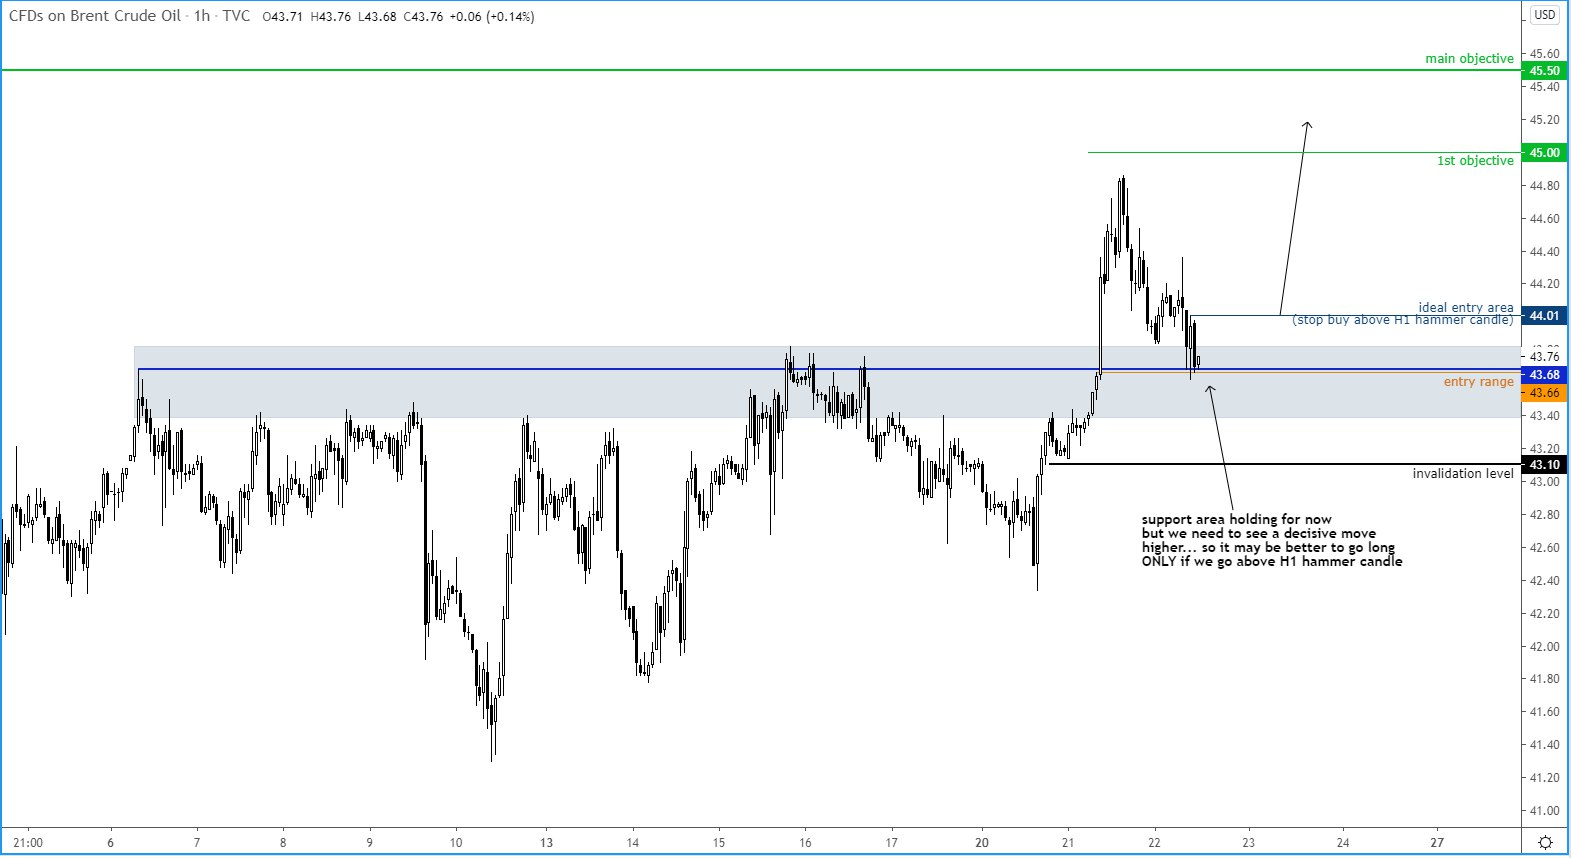
I wrote:The Brent one-hour chart shows a trade idea based on the daily setup. For confirmation you can look to get on board above the hourly candle… if you feel aggressive and don’t want to wait for confirmation, you may also consider taking a position here… I will wait for confirmation personally and will be setting order to go long upon break of 44.00
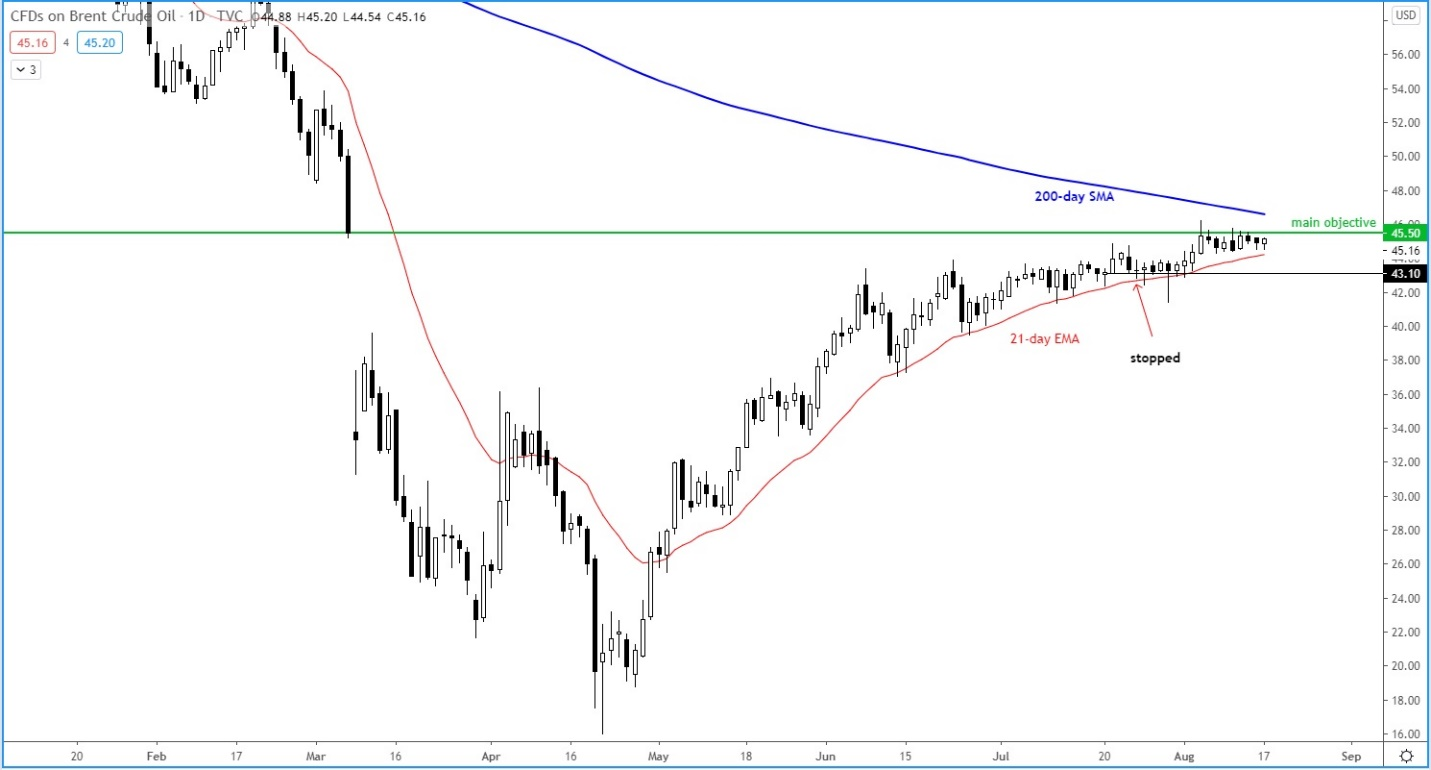
Brent oil decided to pull back deeper before rallying to the main target, thus stopping us out in the process (see chart).
Source: TradingCandles.com and TradingView.com
Example: Gold (Aug. 7, 2020)
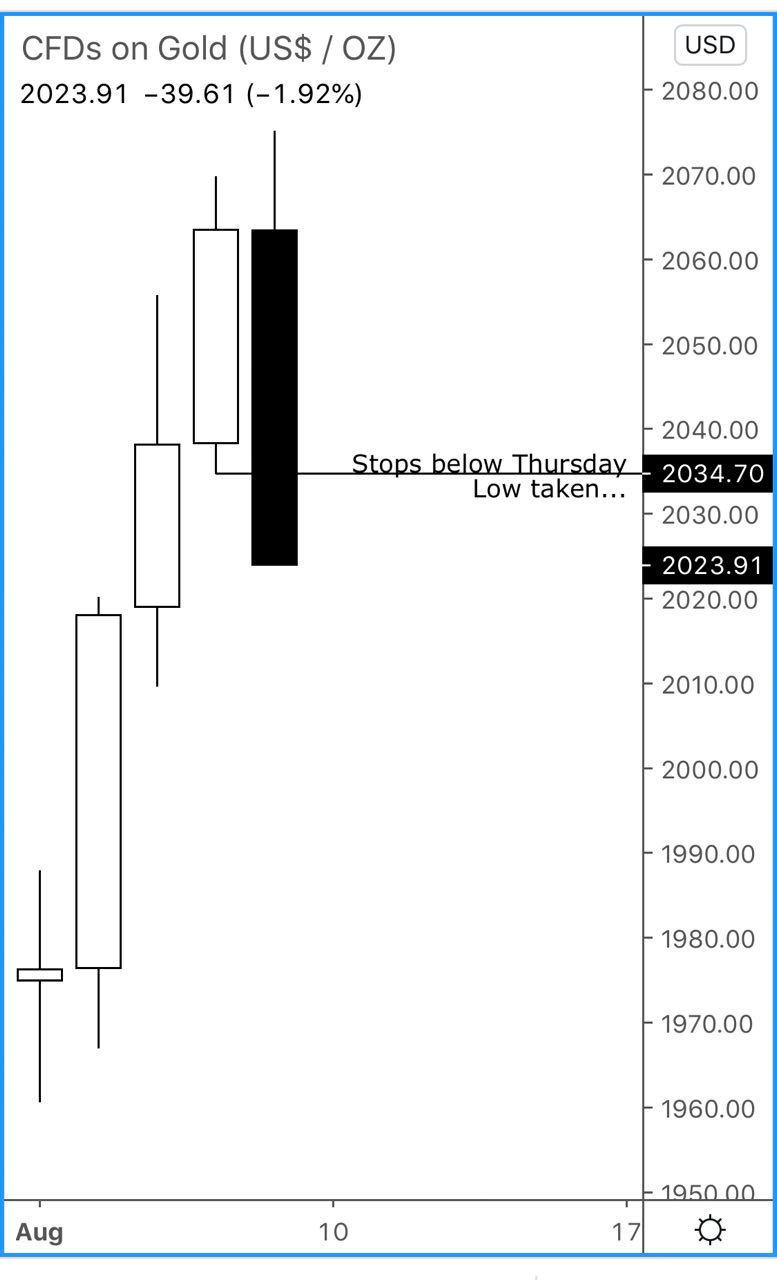
We took losses in a few trades and this gold trade idea was among them. My thinking was that this breakdown was a stop out rather than a reversal (see chart).
Source: TradingCandles.com and TradingView.com
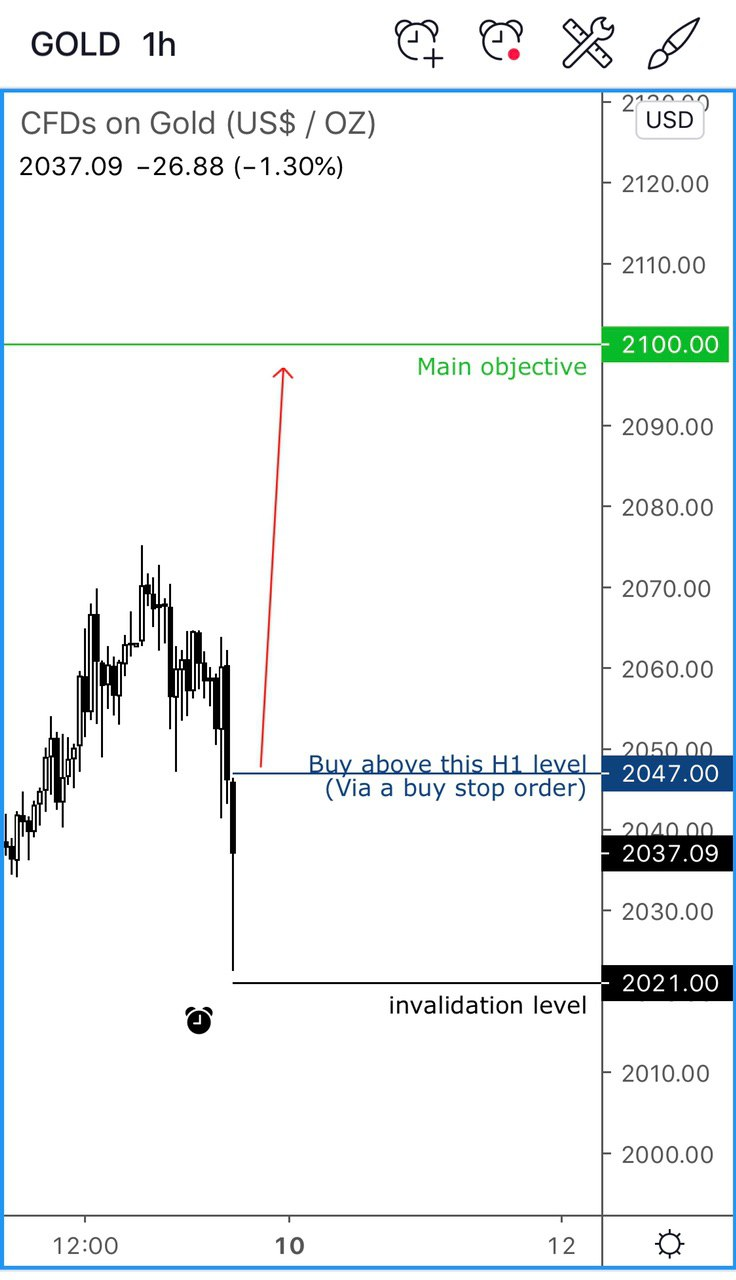
Here is how I presented the idea: Gold long trade idea on one-hour chart, using the above daily chart. We are looking to buy if we go back above this hour’s high, for this would indicate the earlier breakdown was indeed a sell trap. The stop or invalidation is below today’s low. Target above recent highs, where I have shown on the chart.
If gold creates a new low before triggering our entry, then the stop loss will need to be adjusted so it is just below today’s low, whatever that level maybe (unless it goes down by so much that the reward-risk falls below 1:1). But to be clear, we are ONLY entering IF we go back above this H1 high (and thus above Thursday’s low)
Source: TradingCandles.com and TradingView.com
Gold triggered our entry in the following week, but the selling resumed and quickly stopped us.
But we made it up in the next gold trade!
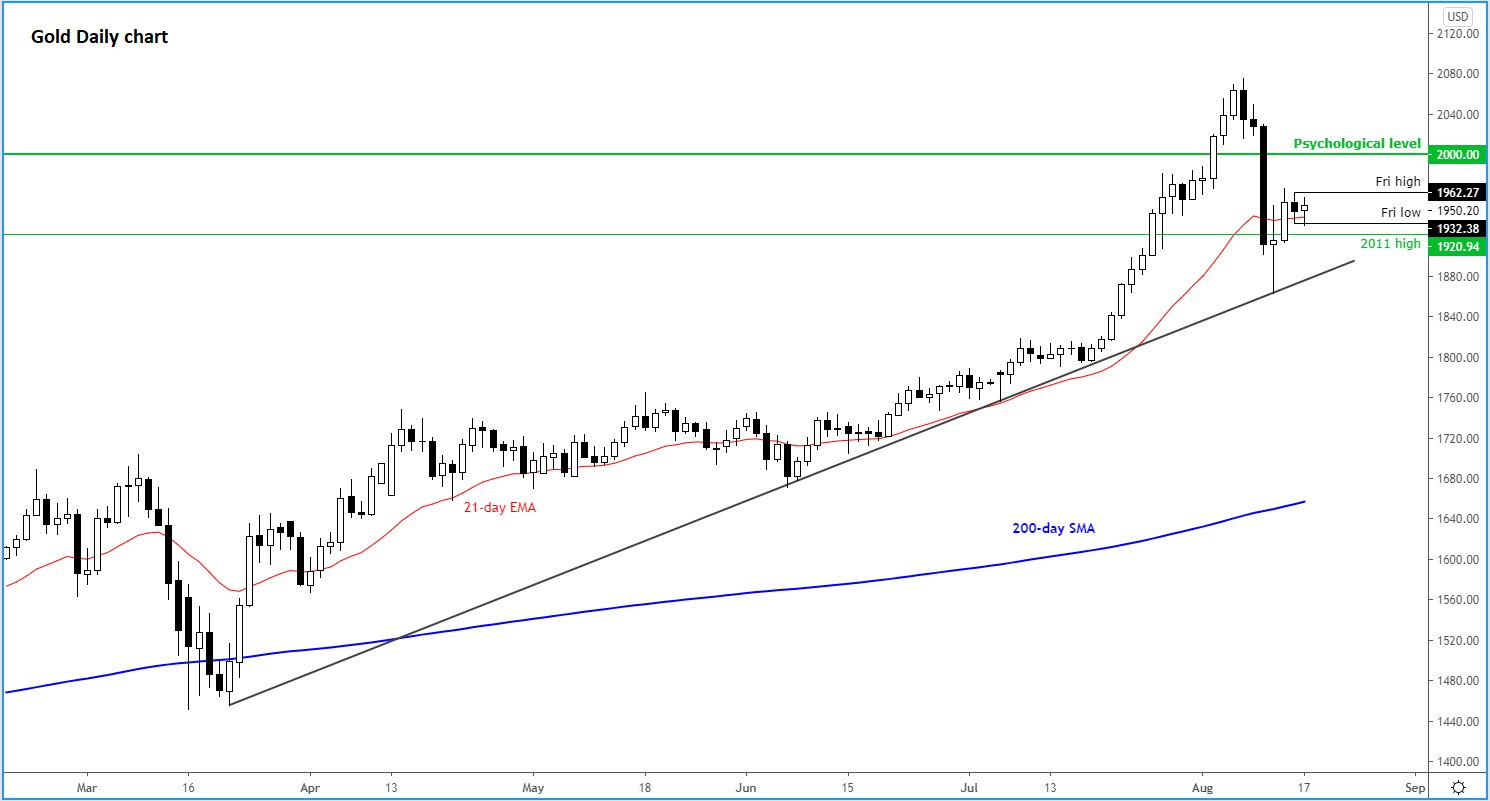
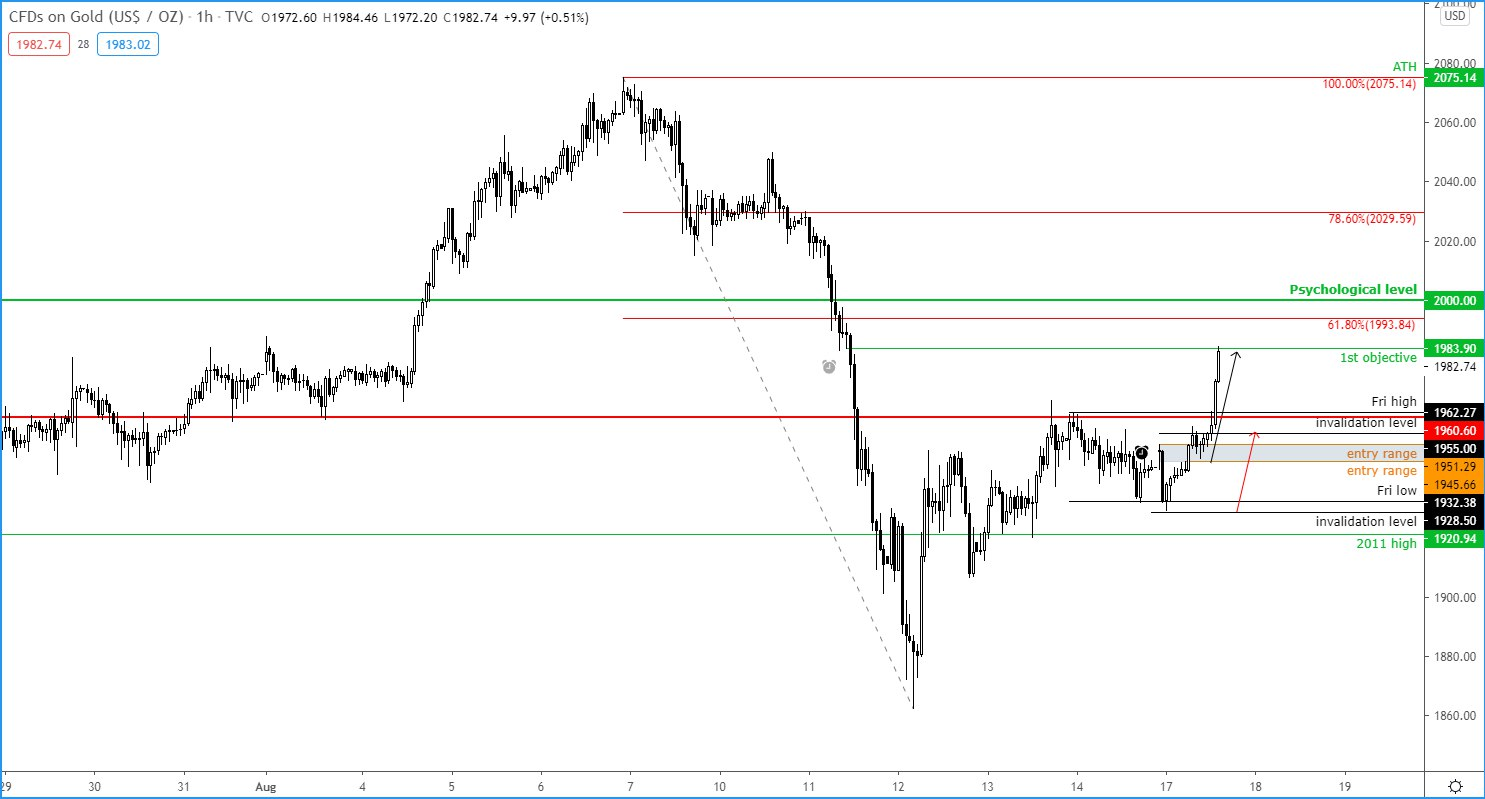
Example: Gold (Aug. 17, 2020)
Following that losing golf trade, I wrote: Gold daily is trying to form a base after its correction last week. So far it is holding above the rising trend line and 21-day exponential… In another bullish sign, it looks like those who sold below Friday’s low are trapped… so from here gold may at least go on to probe liquidity above Friday’s high next
Source: TradingCandles.com and TradingView.com
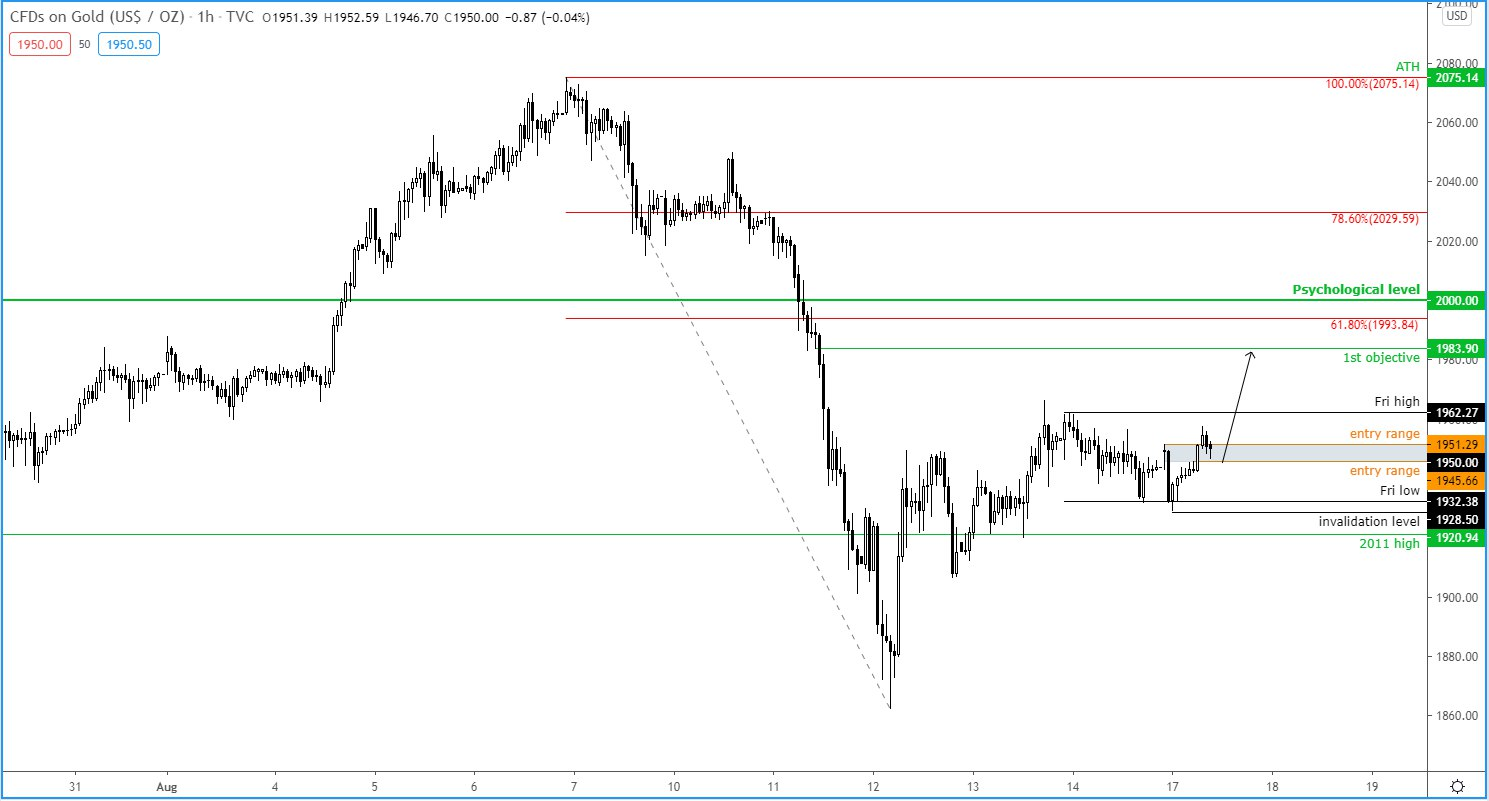
Gold trade idea on H1 chart.
* invalidation is below today’s low, for if price gets there, the bear trap idea we identified on daily would become invalid
* 1st target is just below the 61.8% Fibonacci, and first trouble area based on hourly candles
* 2nd target will be an open target in case gold hits new record highs – so ensure you keep a small portion open!
Source: TradingCandles.com and TradingView.com
Gold didn’t disappoint this time and it quickly hit out first objective (see chart).
Source: TradingCandles.com and TradingView.com
This was on the same day this report was published, so I have no idea whether it will hit a new record high or not. But I did advise the following:
If you are holding (a portion of) this trade for even higher, make sure to keep raising your stops. I have done so for this trade to above entry (below one-hour thrust candle).
These example are obviously just a snapshot of the trade setups I look for. Every situation is different, and when market conditions change so too will my approach. But hopefully you have got some ideas about my approach and learned a few tricks along the way. Please don’t hesitate to get in touch if you have any questions.
Of particular importance is our approach to risk management. Not every trade is going to be a winner, and not every losing trade means you did something wrong. You will have both winners and losers using a solid methodology, so it is important to make the most of your winners and limit the damage in the inevitable losing trades.
Fawad Razaqzada, Senior Market Analyst at TradingCandles.com, is an experienced forex market analyst and economist. He posts market analysis on all sectors. Previously he served as a market analyst with FOREX.com and City Index. Fawad has created a couple of YouTube videos on gold and silver recently, which contain a lot of insights on precious metals and trading in general. You can watch them HERE, HERE and HERE.


