

Al Brooks breaks down the technicals in the long bond.
U.S. 30-year Treasury Bond futures are selling off towards the start of the bull channel on the daily chart. Traders will then expect a bounce and a trading range.
The monthly long bond futures chart formed an outside down candlestick in August (see below). There is only one more trading day in August. The bears want the month to close below the July low. That would increase the chance of at least slightly lower prices in September.
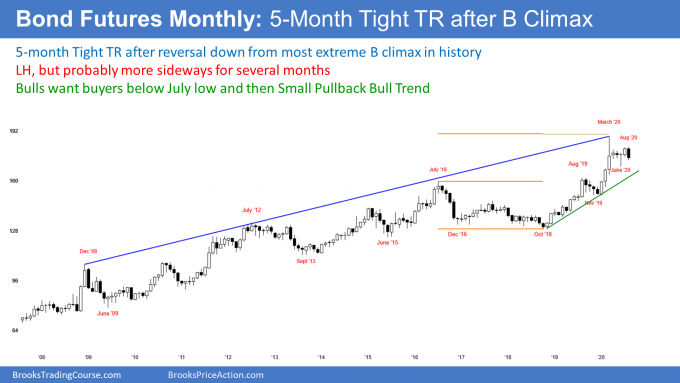
March reversed down from the biggest buy climax in the history of the bond market. Traders are deciding if August was a test of the March high and the start of a bear trend. Alternative, it could be just a pause in the 35-year bull trend before another leg up to a new all-time high.
This month was good for the bears. But the bond market has been sideways for five months. Unless traders see two or three consecutive strong trend bars up or down, they will assume that the five-month tight trading range will continue. After an extreme buy climax, it could continue for 10 or more bars, which means the remainder of the year.
The weekly bond futures broke below a nine-week tight bull channel three weeks ago (see below). That was a small buy climax and a double top with the April 22 high.
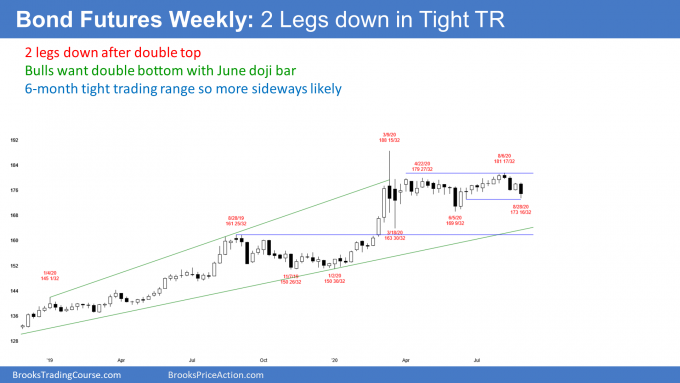
Although last week was a bull bar, I said that traders would sell it since they expected a second leg from the buy climax. Furthermore, there was room to the June 16 low, which was a doji bar after a big reversal up. Its low is therefore a magnet.
Since this week was an outside down week that closed below last week’s low and there is a magnet below, traders expect at least slightly lower prices next week. If next week is a second consecutive big bear bar closing on its low, traders will look for a test of the March low in September.
Sometimes the week after an outside bar is an inside bar. If this week’s low stays above last week’s low and if it week closes near its high, this week will be a buy signal bar on the weekly chart. But because the weekly chart has been in a trading range for five months, traders are not expecting a trend up or down. Instead, they are looking for reversals every two to three weeks.
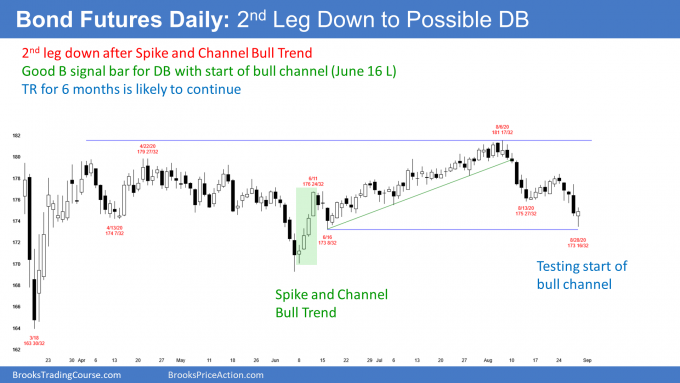
The daily bond futures rallied in a Spike and Channel Bull Trend from the June 5 low. June 16 was the first pullback after the reversal (spike) up. It was therefore the start of the bull channel. A reversal down from a Spike and Channel Bull Trend typically tests the start of the channel. Therefore, the June 16 low is a magnet below.
I said that last week’s rally was going to be a bear flag. That is because traders expected a second leg down from the break to far below the bull channel.
Also, they know that the reversal usually reaches to around the start of the bull channel. Did this week’s low get close enough? It might have, especially since Friday was a big bull reversal bar closing near its high. It is a buy signal bar for Monday.
The bulls have a High 2 buy signal with the Aug. 13 low, and a double bottom with the June 16 low. Traders should expect a reversal up from here or from slightly lower. The first target is the Aug. 13 lower high.
But whether or not this week is the end of the swing down, traders know that a Spike and Channel Trend typically evolves into a trading range. Consequently, even if the selloff continues to below the June 16 low, traders will look for a leg up in the developing trading range.
This is consistent with the weekly and monthly charts already being in trading ranges. Markets have inertia. They tend to continue to do what they have been doing. Therefore, a developing trading range on the daily chart would simply be a continuation of the trading range on the weekly and monthly charts.
Trading Room
Traders can see the end of the day bar-by-bar price action report by signing up for free at BrooksPriceAction.com. I talk about the detailed E-mini price action real-time throughout the day in the BrooksPriceAction.com trading room. We offer a two-day free trial.


