

Divergence is the stock indexes may indicate a correction ahead, reports Joon Choi.
The S&P 500 Index (SPX) reached new highs on Aug. 18 and managed to make three record closes since, which means that the index recovered from its bear market low on March 23 in 126 trading sessions. This is the fastest recovery on record as it beat its previous record of 310 days (from Feb. 9, 1966 to May 4, 1967).
What is more astounding is that the Nasdaq-100 Index (NDX) managed to recover in 71 days (from March 20 to June 3) as investors sought mega-cap technology stocks that benefited from the remote working/schooling shift caused by Covid-19. Moreover, NDX has rallied 68% from its March lows. here, I will discuss potential cracks showing in the Invesco QQQ Trust Series 1 (QQQ) charts as the current rally seems too fast and too quick. QQQ is the exchange traded fund based on the NDX.
Indicator explanation
In 2010, oscillating stock market breadth indices were created to provide better technical insights. One of these indicators measures the percent NDX stocks are above their respective 50-day moving averages (NDX50MA%). There are also indicators tied to different moving averages based on other indices such as the S&P 500 and Nasdaq Composite. One of the main advantages of using the NDX50MA% is that it highlights how broad the market rally is.
NDX50MA% is not confirming the rally
The uncertainties brought on by the current pandemic have been overcome by both the investors’ confidence from the Fed’s liquidity injection and warp-speed vaccine developments. However, there is cause for a concern as the NDX50MA% is not confirming the current NDX rally (Point E on below chart).
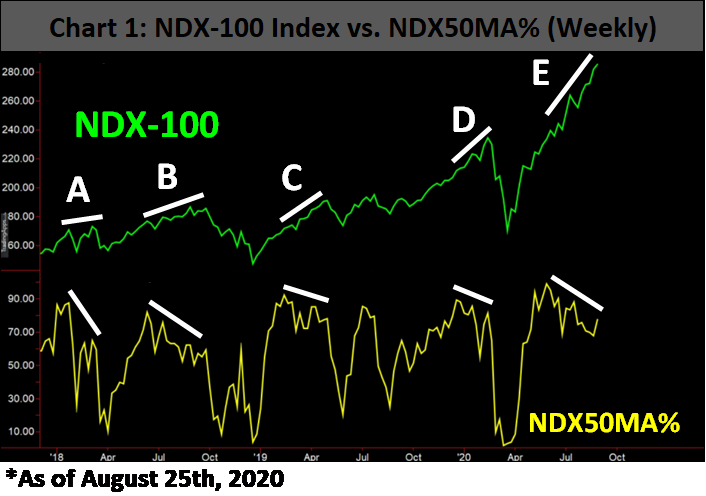
The importance of this negative divergence is that it appeared four other times prior to sharp selloffs. The formation occurred in late 2018 (Point B) before a 23% drop in early 2020 prior to a bear market selloff of 28%. The current set up is most like Point C as it formed after a sharp recovery from 2018 bear market low. NDX fell 11% from April 29, 2019 to June 3, 2019.
Option investors seem to concur
The CBOE NASDAQ 100 Volatility Index (VXN) Index measures the market’s expectation of near-term volatility in the Nasdaq-100 Index based on index option prices, similar to how the Cboe Volatility Index (VIX) measures the S&P 500’s volatility expectations. An option-based volatility index tends to fall as its underlying index rallies. But what’s now intriguing is that after VXN hit a post-pandemic low on June 5, the volatility index is 9% higher even though NDX has since rallied 19% (Point E on below chart).
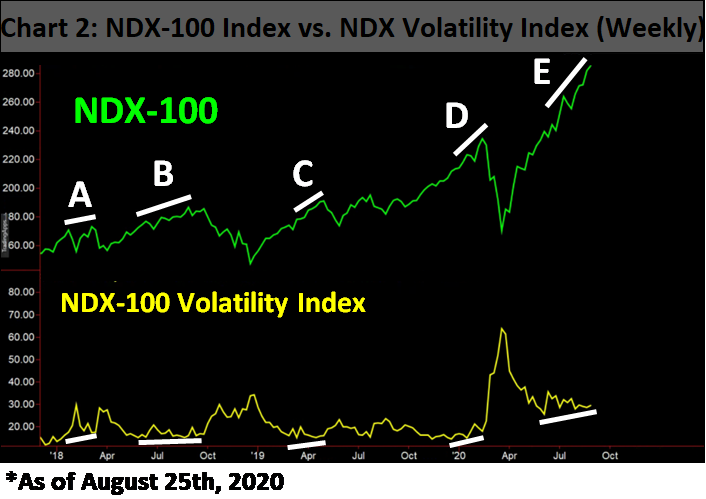
Furthermore, VXN had steadily increased during the period from Point A through D when NDX marched higher. Coincidently, NDX50MA% weakened during the same time periods.
Conclusion
It is somewhat baffling that stock market participants are painting a much rosier picture than what current data indicates. The speed at which the Nasdaq-100 recouped its bear market losses is astounding. However, a rising VXN and declining participation of stocks during the current rally may be an indication that stocks may stall or see a 10% drop.
Although it may be agonizing to own SPY instead of QQQ, I would resist the temptation to switch from the former to the latter as large cap technology space seem crowded.
Lastly, if VXN closes below the June 5 low of 25.53, or NDX50MA% closes above the July 17 high of 88.35%, then the likelihood of a stock market weakness will drop considerably, and the bearish pattern will no longer be in play.


