

Tuesday’s session played out as an inside/range day per expectations given Monday’s temporary bottom context, states Ricky Wen of ElliottWaveTrader.net.
Essentially, price action formed an intraday double top after the RTH open and then bottomed out by 11:00 am in order to grind up towards 3300 on the E-mini S&P 500 (ES) for the rest of the time. The overall range was 3309.5-3256.50, including overnight globex hours.
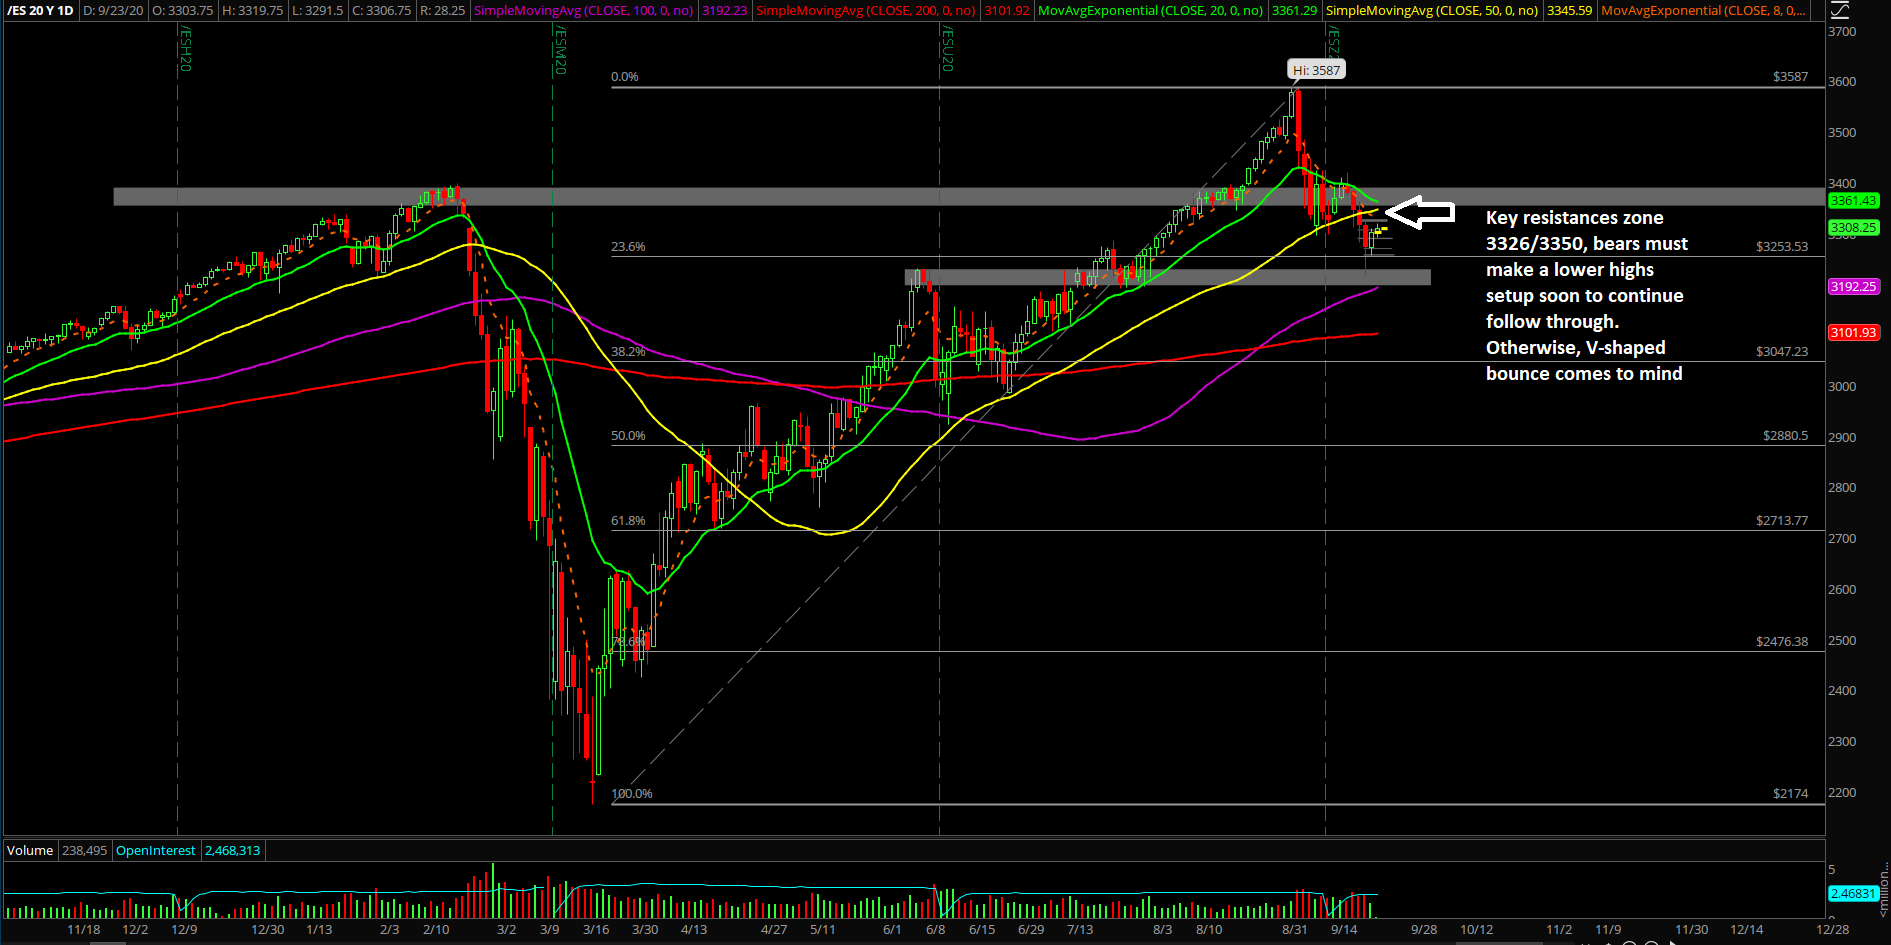
The main takeaway remains the same as short-term trend on the daily chart remains bearish, and this is still treated as a deadcat bounce until further evidence. Today is an important day for bears to turn things around given the context and where price action is hovering just below some key resistance levels such as 3326/3350. Make or break sort of playbook as we’ll be stalking for a southbound train ride soon unless proven otherwise.
What’s next?
Daily closed at 3300.75 on the ES around the highs of the day indicating that inside/range day was a success. Now, price action is hovering at 3307~ as RTH is about to open. Sunday high of 3326~ and last week’s key 3350 resistance will provide us with clues on the next big movement. Whether we get the expected lower highs or the deadcat bounce is morphing to something else like a V-shaped bounce.
A summary of our game plan:
- For now, our short-term bias on the daily chart timeframe remains bearish as long as the SHTF (sh*t hits the fan) level of 3350 or the trending daily 20EMA resistance (currently at 3360s and changing) remains intact due to the past two weeks’ context.
- Today should be treated as another inside/range day similar to yesterday. However, based on the context, bears need to fulfill their goal of a lower highs setup soon in order to disallow the current deadcat bounce from becoming something more like a V-shaped bounce
- We will be utilizing key resistances such as 3326 Sunday high and 3350 SHTF level to look for any potential lower high turns to setup for the next downside follow through if/when applicable.
- Quick observations that may be a cause for concern: price action has now reclaimed the trending 1hr 8/20ema and 4hr 8/20ema resistances, so they have turned into supports with price hovering above it. This means that this could be turning into a set of higher lows and higher highs, so monitoring how price action revolves around these key moving averages will be pivotal.
- For reference, a daily closing print above 3350 would be a huge hint that price action is exhibiting signs of V-shaped bottom and any sustained movements in the coming days above that key level would act as confirmation.
Ricky Wen is an analyst at ElliottWaveTrader.net, where he hosts the ES Trade Alerts premium subscription service.


