

Last week was mostly a downtrend week from Monday-Thursday with lower highs and lower lows, reports Ricky Wen of ElliottWaveTrader.net.
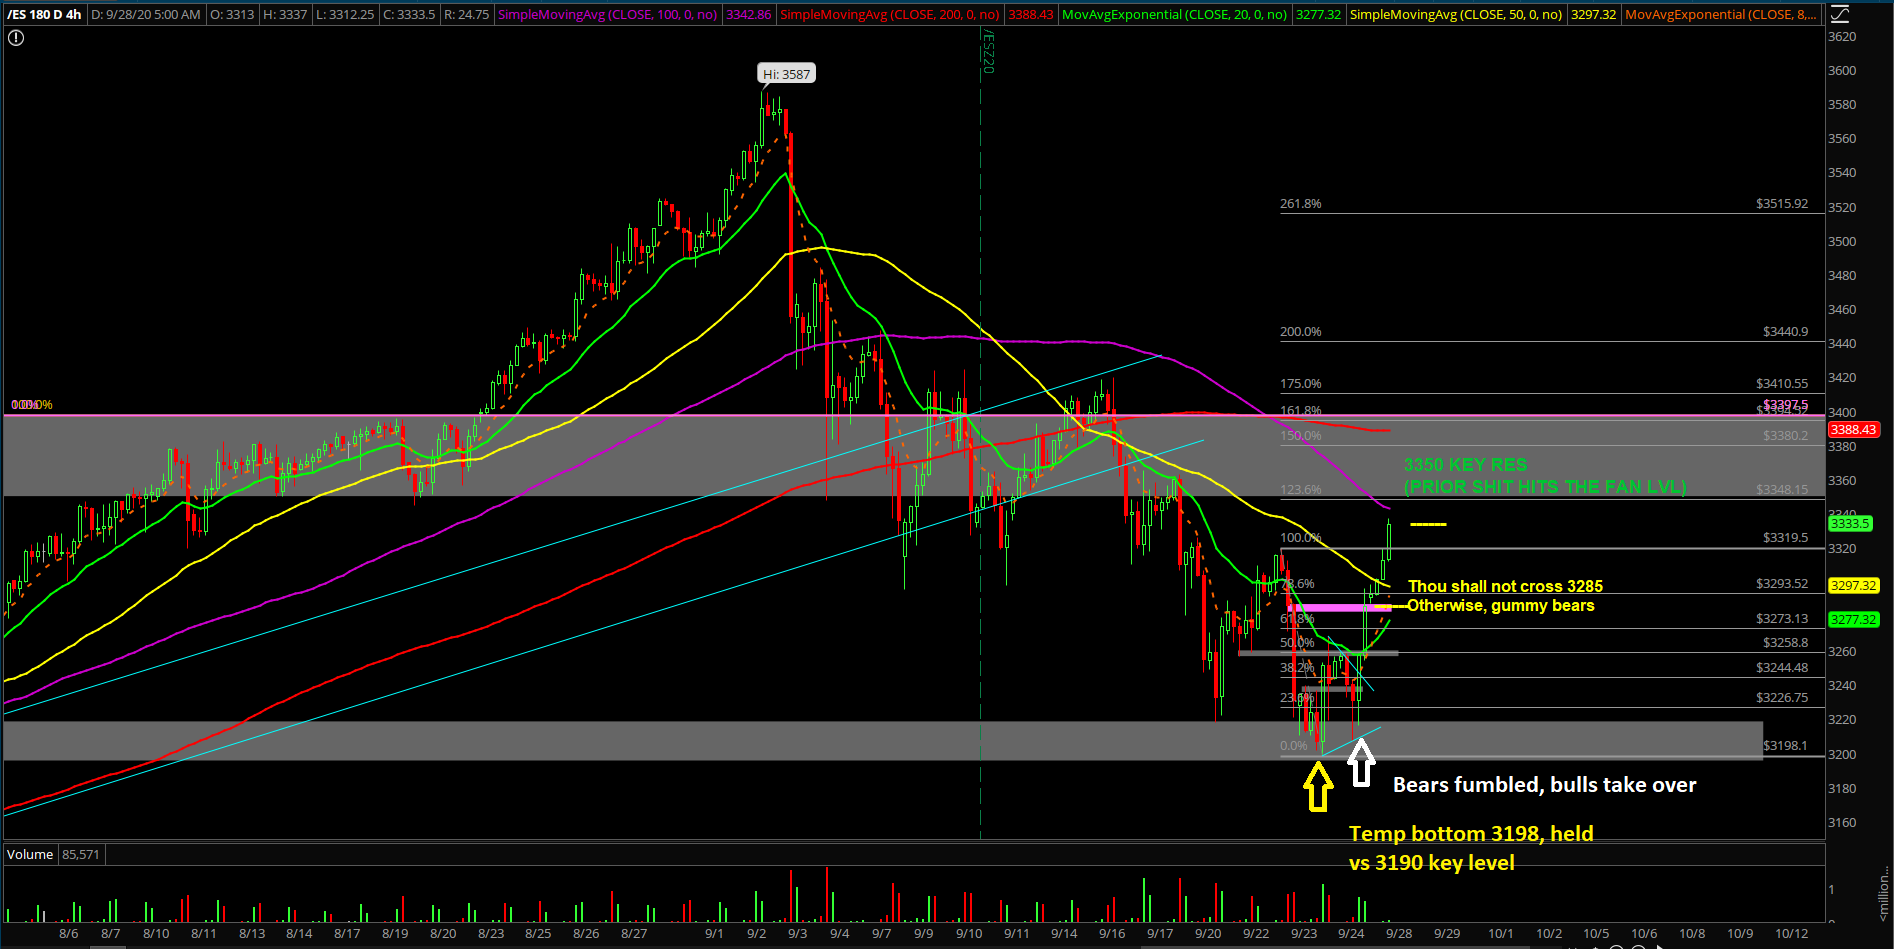
The bears needed to close Friday at the lows or near the lows in order to retain momentum heading into this week. But Friday morning, the lower lows opportunity was immediately squashed with a V-shape reversal back into the 3337, and then the rest of the day was spent grinding higher because short-term bears were trapped, so the opposing side was running into the 3268/3285 next key levels.
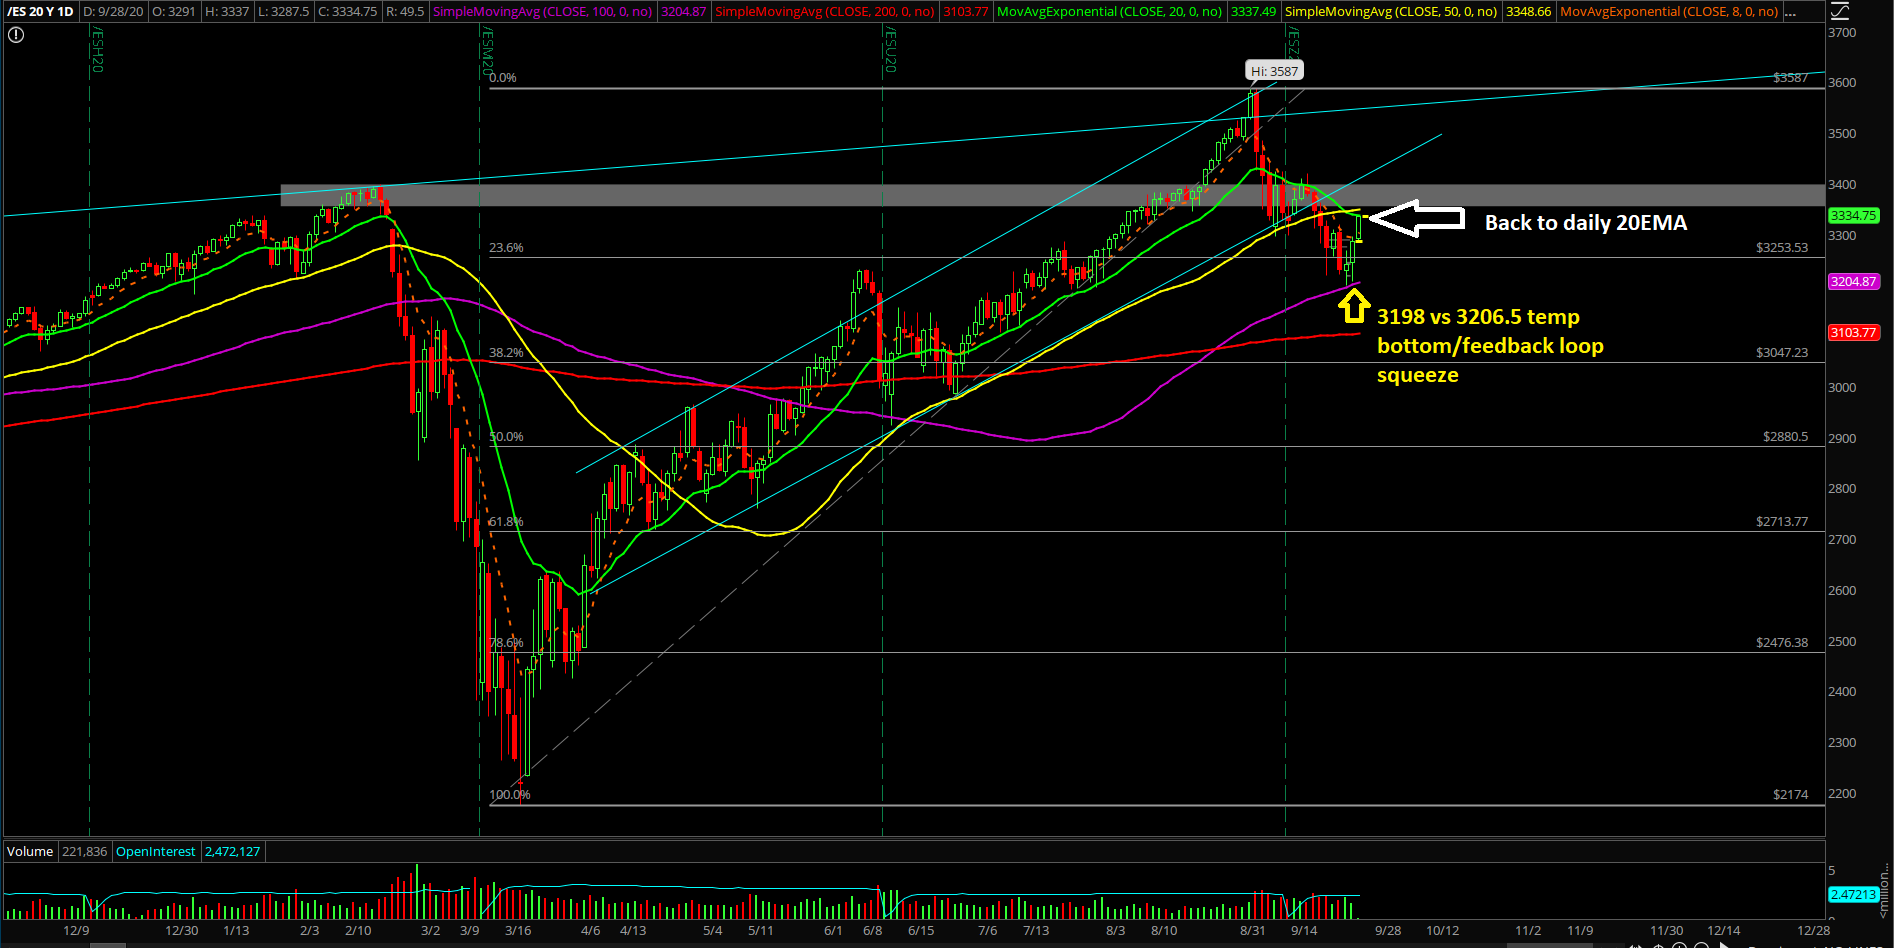
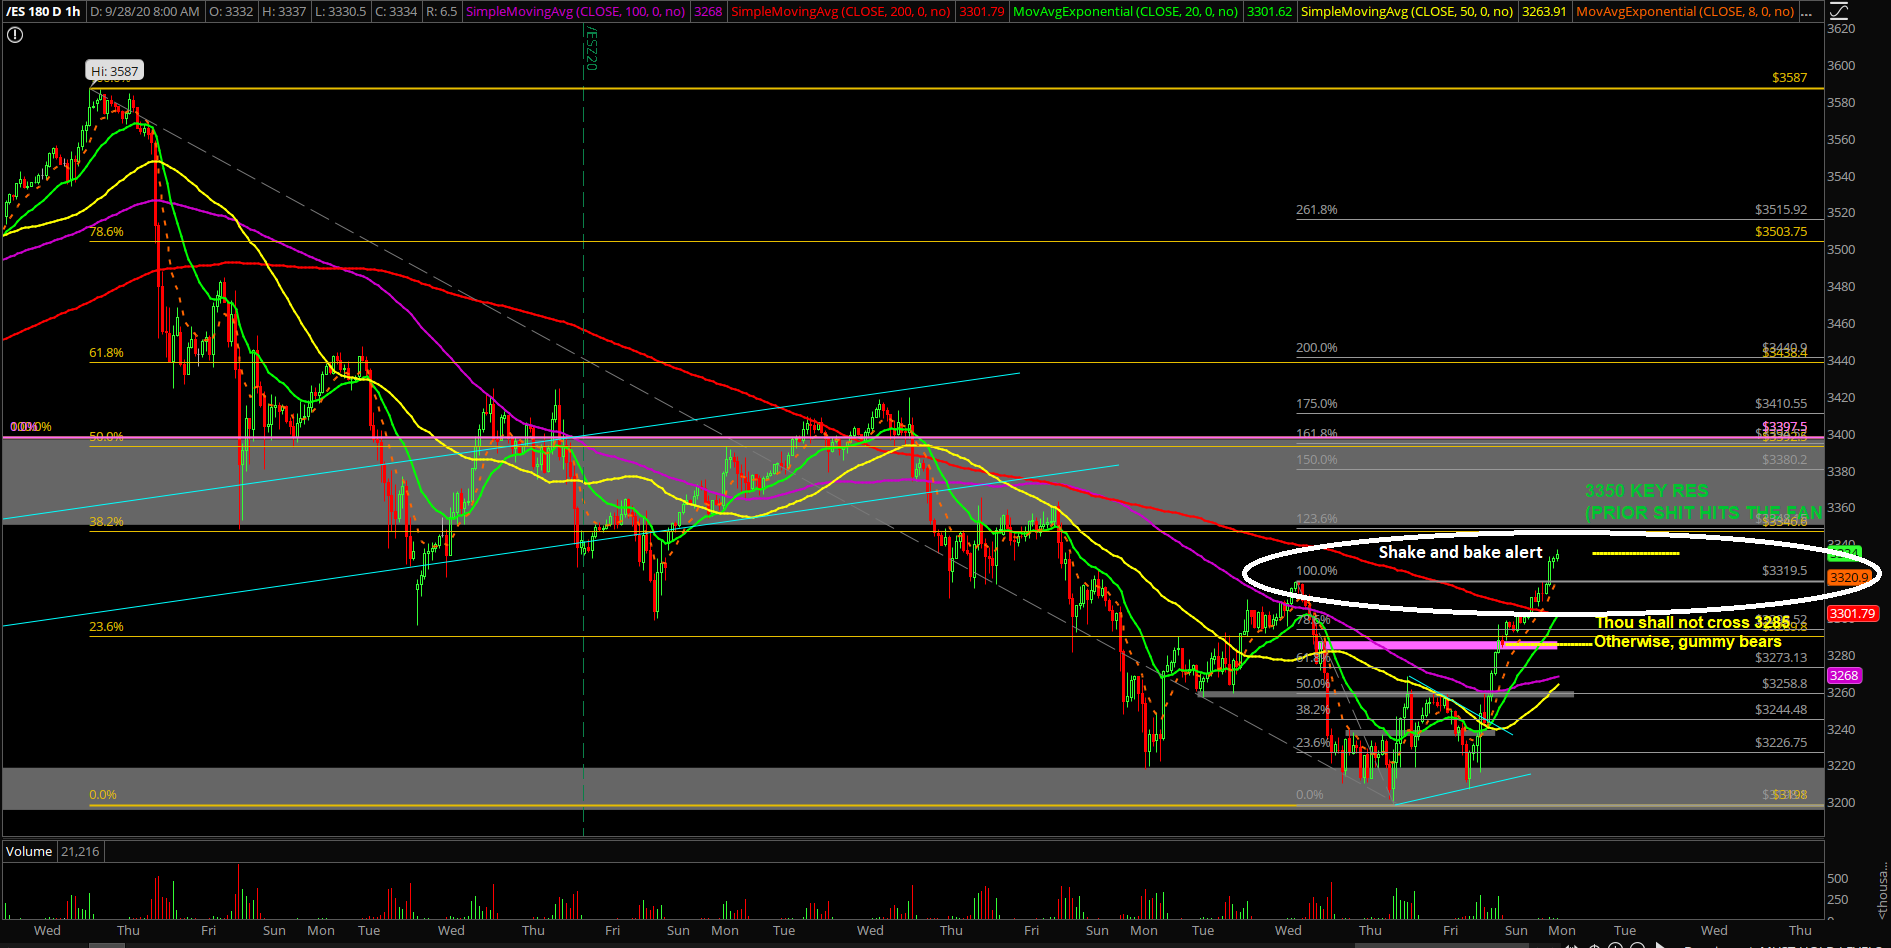
The main takeaway heading into this week is whether 3330-3350 key resistance region on the E-mini S&P 500 (ES) can formulate the next daily lower highs, or whether the temporary bottom from last week is turning into more of a concrete bottom for the bigger picture. This is the neutral ground territory given the key battleground being established with the current backtest into the 3330s trending daily 20EMA resistance alongside 38.2% fib retracement and the prior (SHTF) shit hits the fan level of 3350.
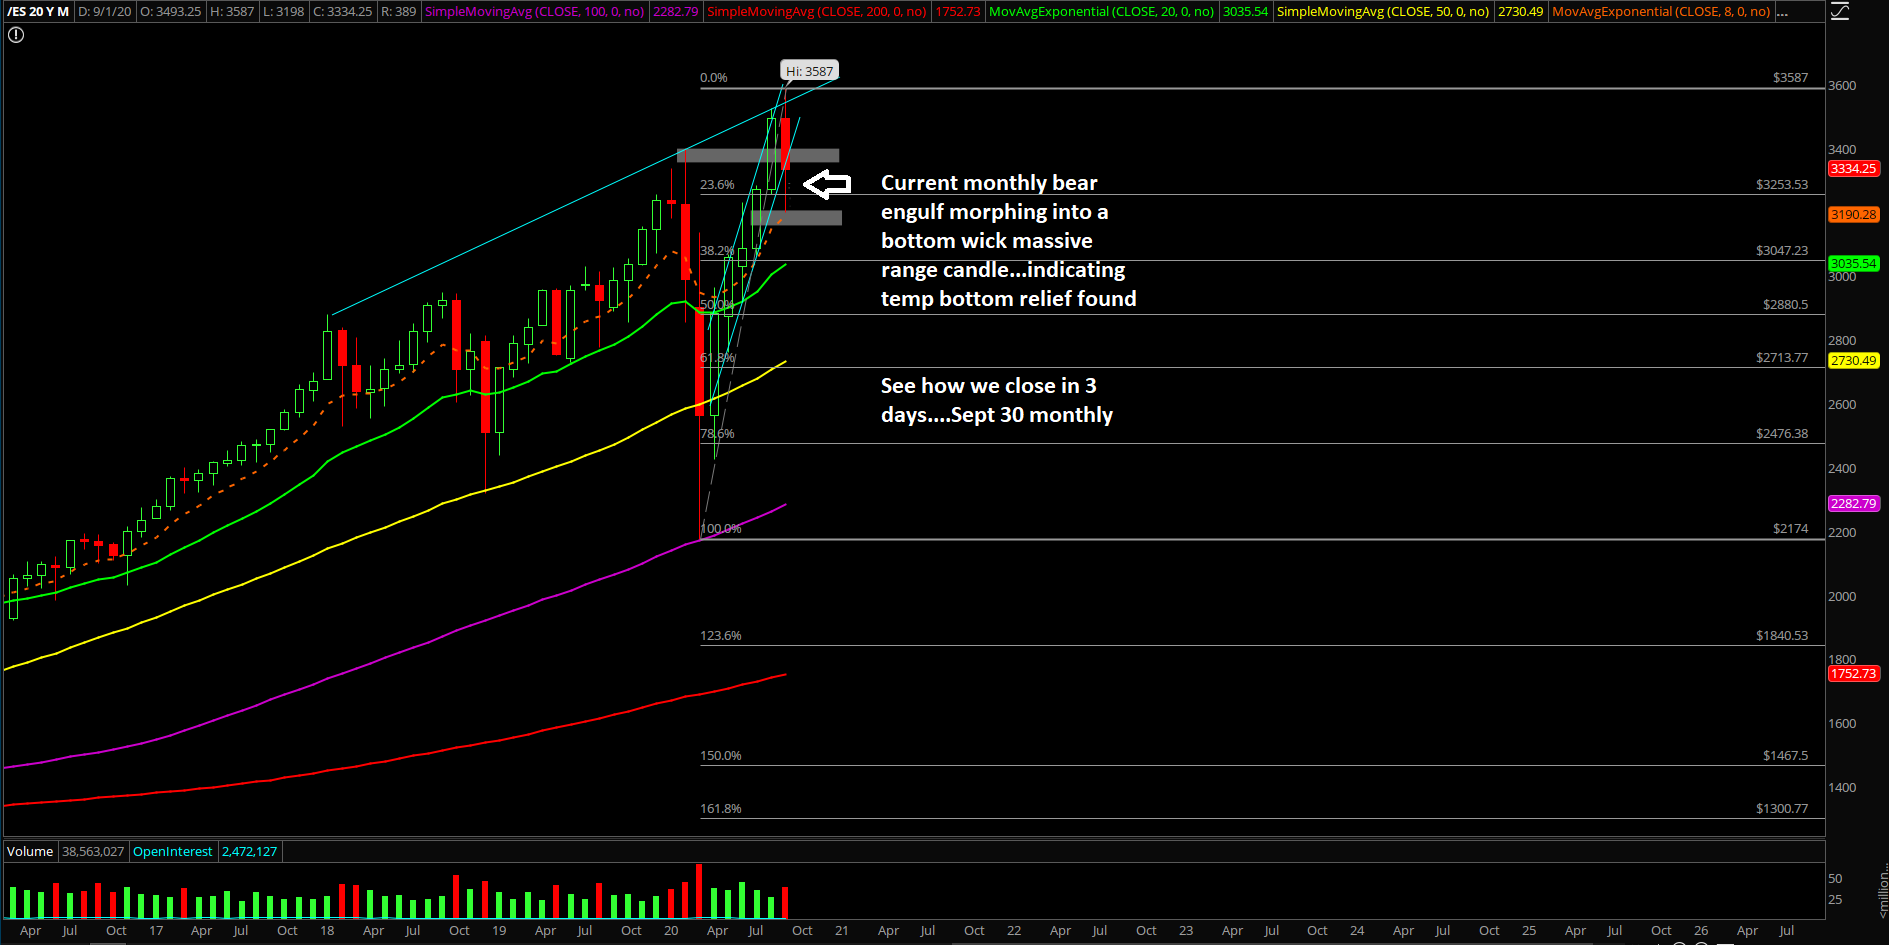
What’s next? Expect some "shake and bake" action until a real victor appears on the bigger picture timeframe. There will likely be lots of head fake action as we head into the Wednesday Sept 30 monthly closing print, where the market should offer some more clues as it heads into October and Q4 2020.
Highlights of our analysis:
- Bears fumbled on Friday Sept 25…and now it’s time for the bulls’ turn to see if they can score.
- Wait and see whether bulls are able to conquer 3330/3350 key levels on a daily closing basis.
- We remain in neutral mode right now as daily 20EMA is being backtested (3330s) and with price action being this near the previous SHTF (shit hits the fan level) of 3350, need to see more info.
- Utilize current overnight levels of 3337 vs 3287.5 as a potential range and see how RTH opens. We'll treat Monday as a range day bias and utilize range day trading strategies until we see something that changes this assessment
- This means that the 3285 key level area and also Friday’s closing print will act as short-term support/potential higher lows as we head into this week and also 3330-3350 as a potential temp high for Monday.
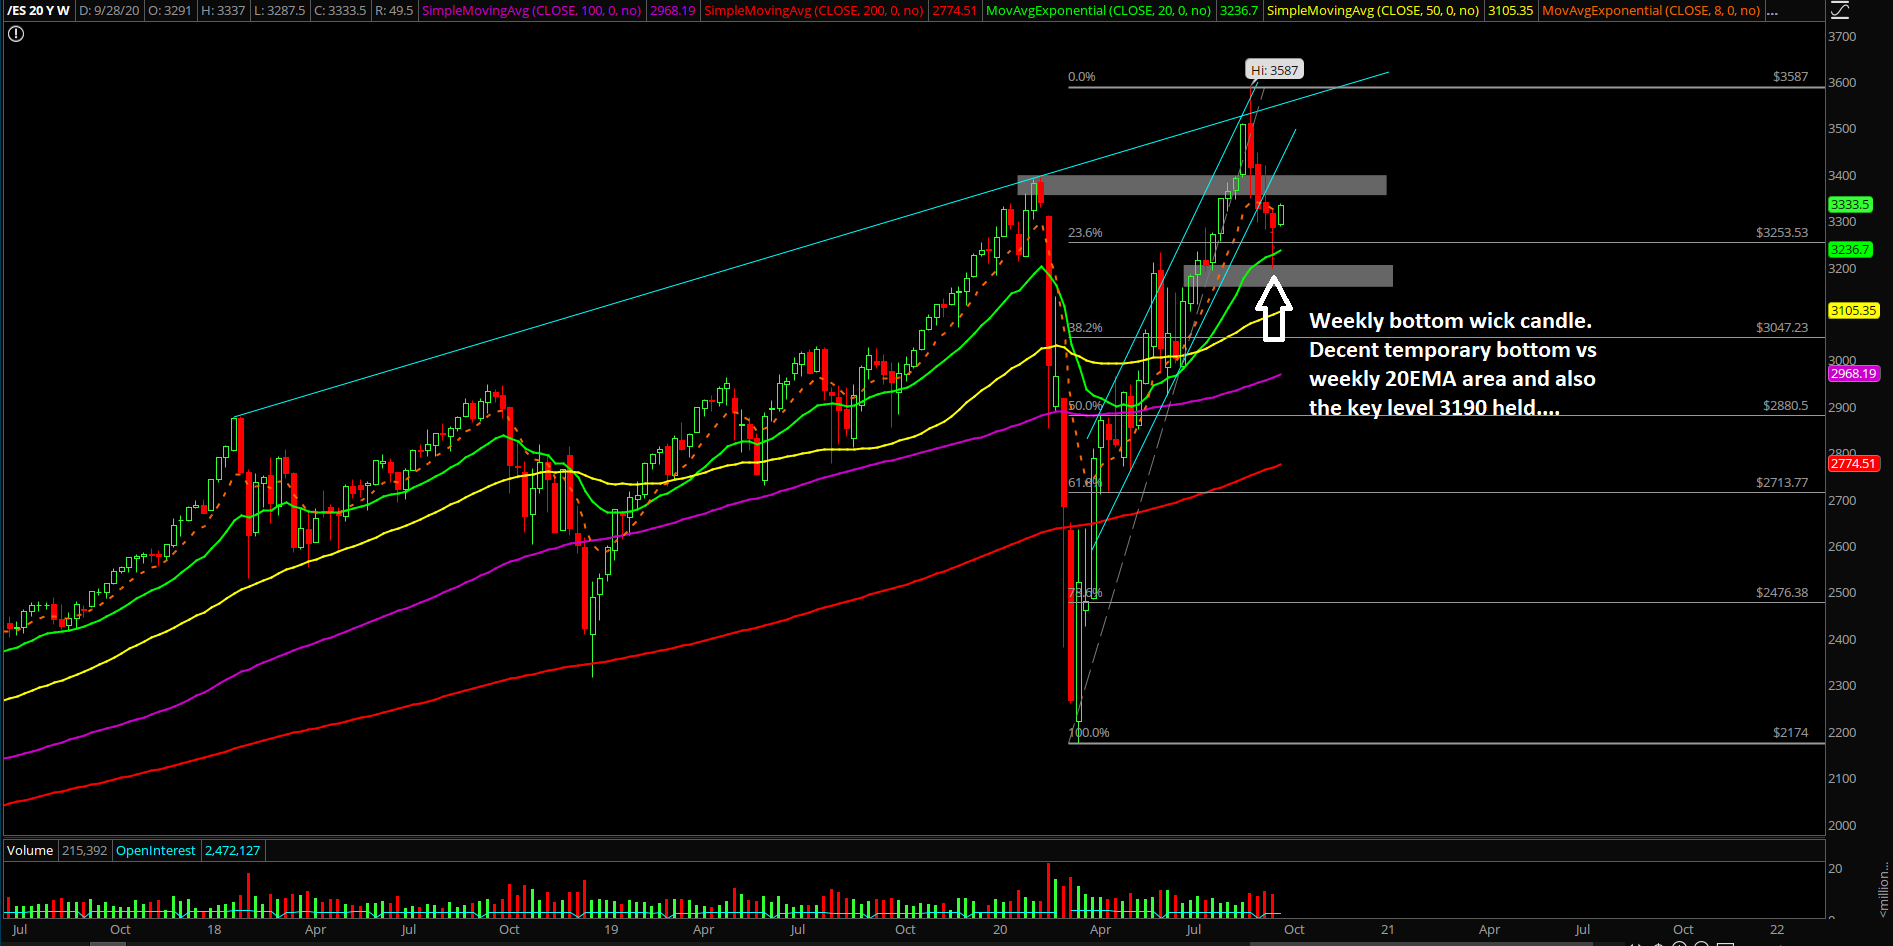
- Currently, we have a temporary bottom setup from the 3196 vs 3206.5 double bottom and we’re waiting for price action to tell us whether this is a stronger bottom or just a temporary bottom.
- Monthly closing print is occurring on Wednesday, Sept 30, and the current assessment is that it’s going to be a bottom wick "stick save," indicating that bears are unable to close at its low to retain momentum heading into Q4 2020. This means that the current temporary bottom could be the start of a bigger bottom as the bigger picture for this year is trying to wrap up at highs during year end. Know your timeframes here.
- Zooming in, there’s a current feedback loop squeeze setup from last Friday as the bears failed to retain pressure as their hopes of immediate continuation towards their downside targets were squashed by the V-shaped reversal 3206->3285
- We warned about adjusting your mentality when a perfect setup fails previously, and it’s exactly what occurred on Friday as many were betting on downside continuation, but it never materialized, so we had to switch to a temporary bottom/double bottom formation given the dynamic price action changes. Being nimble and adaptable is a must when the market provides crystal-clear level-by-level approach.
Ricky Wen is an analyst at ElliottWaveTrader.net, where he hosts the ES Trade Alerts premium subscription service.


