

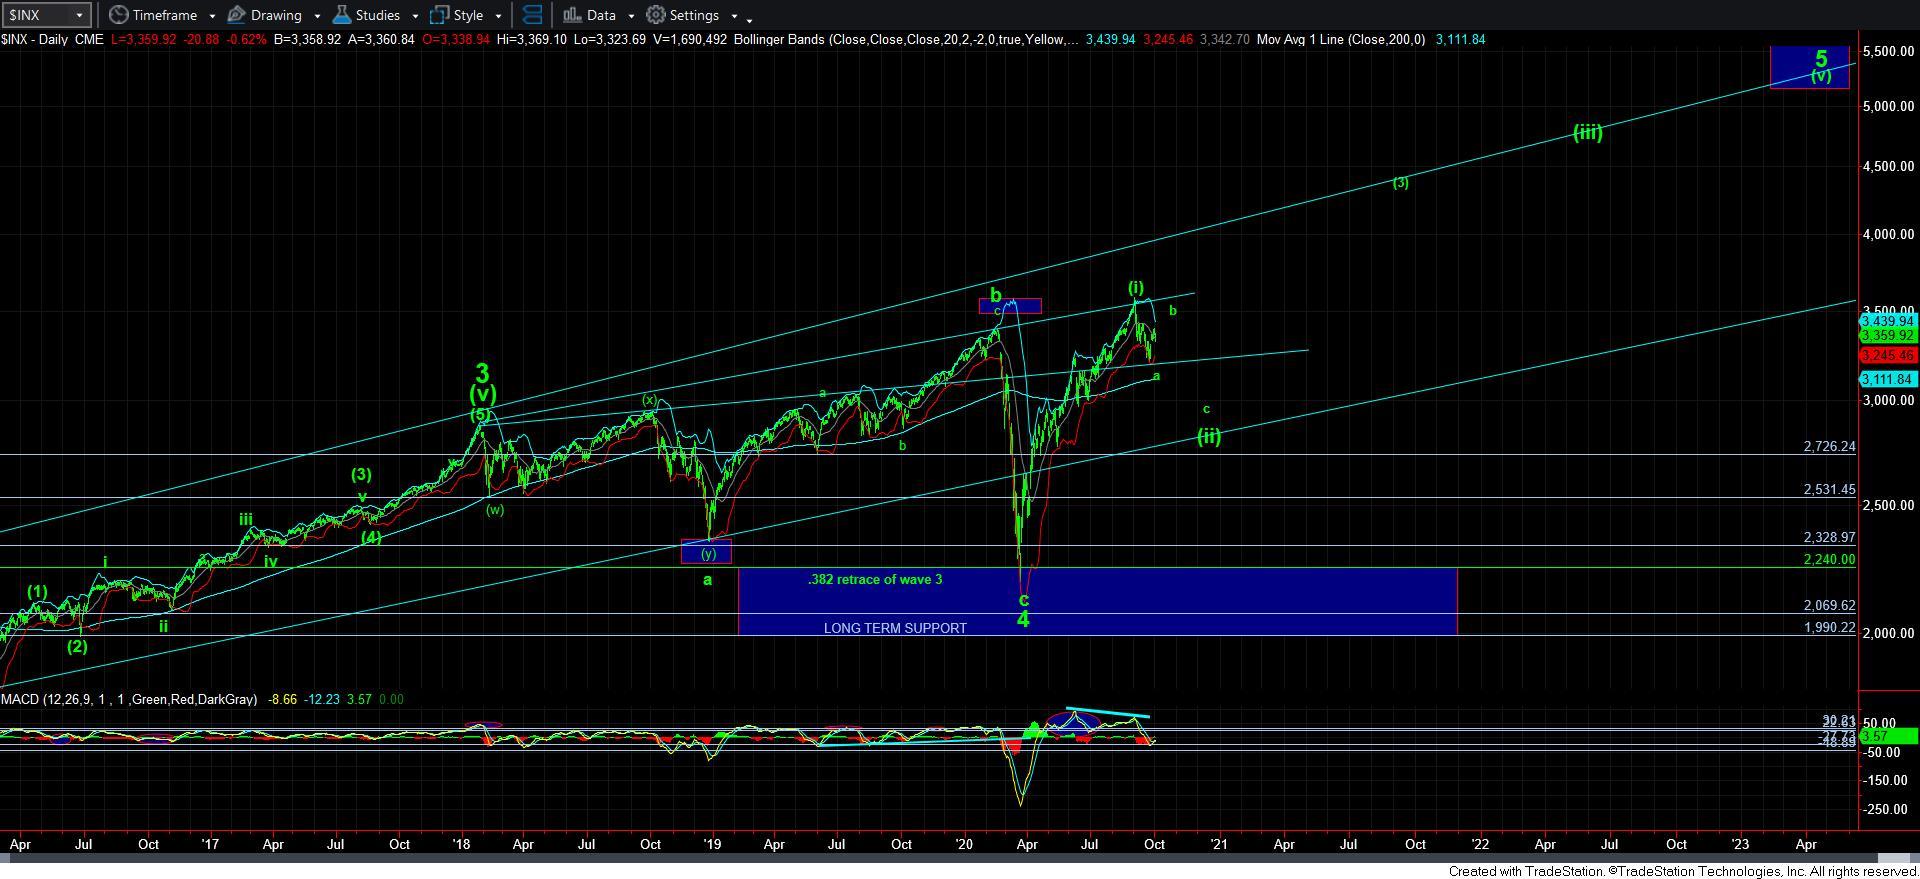
For those of you who follow me closely, you would know that I announced my desire for the market to strike the 2,200SPX region back in late 2017, states Avi Gilburt of ElliottWaveTrader.net.
That was my ideal target to be struck before the market began a rally, which I expected would exceed the 4,000SPX region. I again reiterated this potential in early January of 2020:
“If the market is unable to maintain that support (3,100SPX) within this pullback, it will again raise the probabilities of seeing the 2,200SPX region before we see the 4,000 region.
For now, the market has drawn its lines in the sand, and is providing us rather clear guideposts for 2020. As I said last year, the action in the first quarter of 2020 will set the tone for the rest of the year.” (January 26, 2020)
When we were down below 2,400SPX this past March, I reiterated many times that I still maintain an expectation that the market was going to rally to 4,000 and potentially even exceed it:
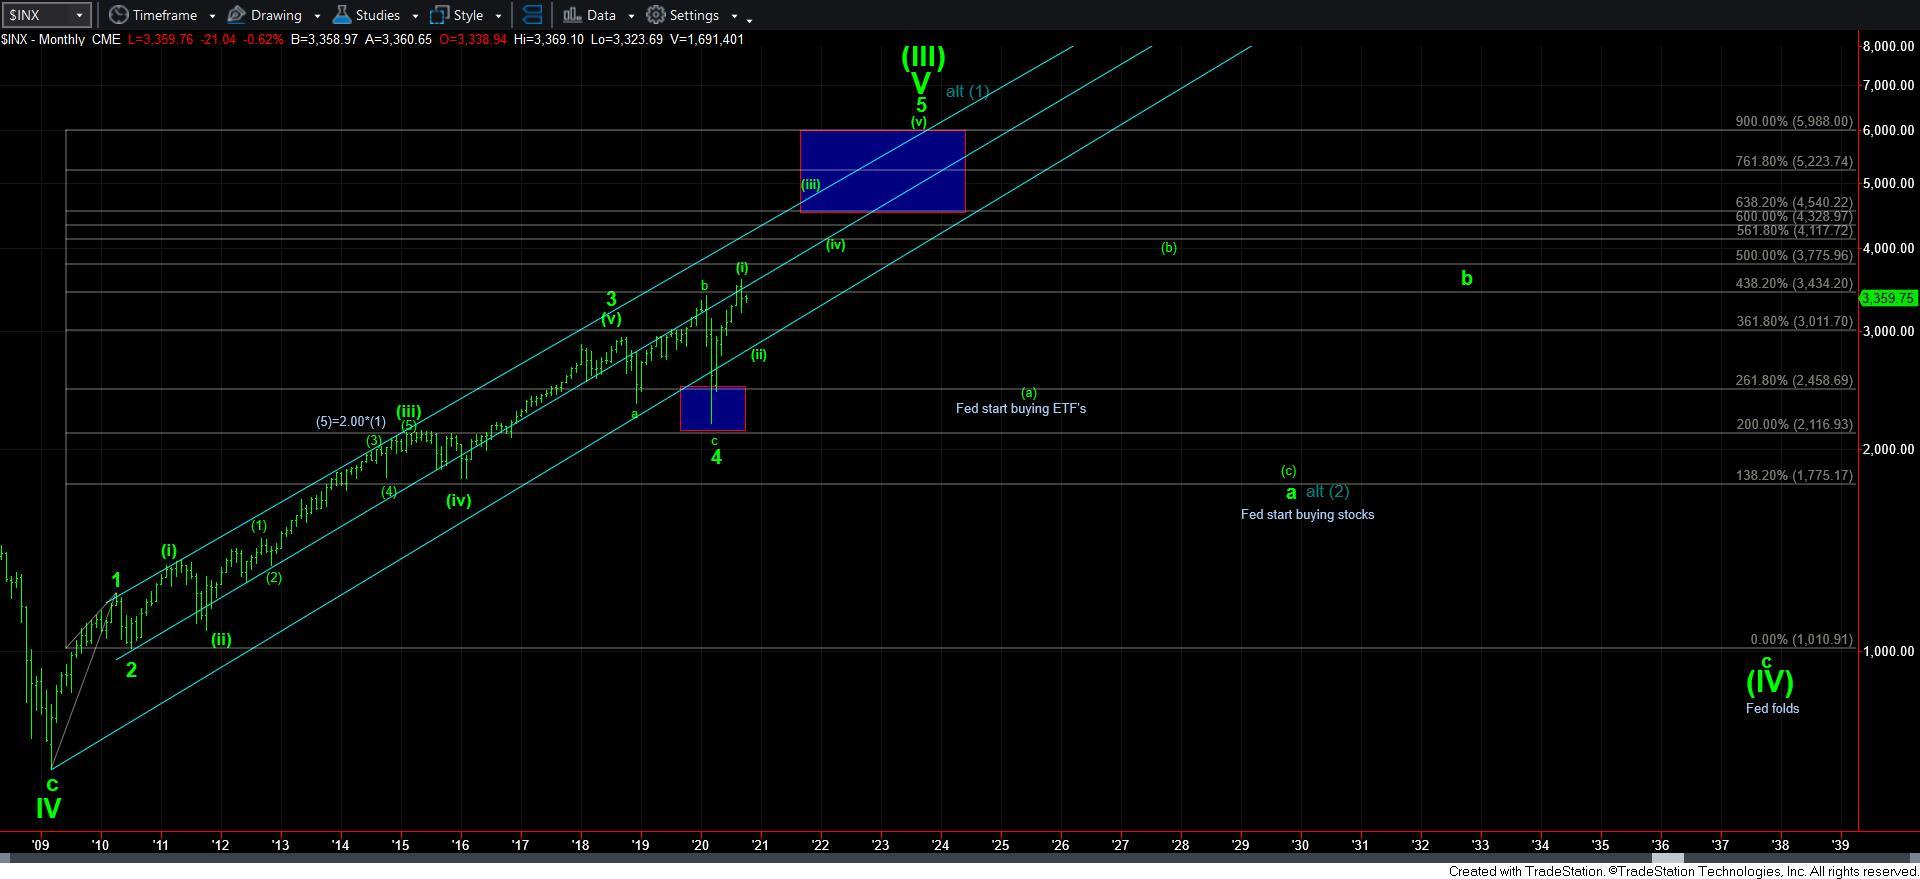
"The evidence leads me to conclude that we need a 5th wave to 4,000+ in the coming years before the bull market off the 2009 low completes.” (March 22, 2020)"
When I continually reiterated my expectation to the members of my services in March, it seems they were quite divided as to how to view my expectations, or even my sanity. Even my wife questioned me when I asked her to put the cash back into the market within our children’s 529 plans with “are you sure?”
Well, the market is still setting up for the 4,000-4,250SPX target, but that will likely only be the next waypoint as we can eventually climb as high as 6,000SPX in the coming years.
Now, many of you are asking yourself what the catalyst will be to take us there? Well, this market has followed through with our general expectations for many years and we did not need to know what the catalyst was going to be. So, I maintain my expectation no matter who wins in the coming presidential elections. And, yes, I said the same back in 2016 when I predicted that the market was heading to the 2,600+ region (when we were down in the 1,800 region) no matter who won the 2016 election.
You see, if one understands the true internal workings of the market, it is much easier to tune out the noise and focus on what is truly important. A paper entitled Large Financial Crashes, published in 1997 in Physica A, a publication of the European Physical Society, outlined the true nature of the market quite well:
“Stock markets are fascinating structures with analogies to what is arguably the most complex dynamical system found in natural sciences, i.e., the human mind. Instead of the usual interpretation of the Efficient Market Hypothesis in which traders extract and incorporate consciously (by their action) all information contained in market prices, we propose that the market as a whole can exhibit an “emergent” behavior not shared by any of its constituents. In other words, we have in mind the process of the emergence of intelligent behavior at a macroscopic scale that individuals at the microscopic scales have no idea of. This process has been discussed in biology for instance in the animal populations such as ant colonies or in connection with the emergence of consciousness.”
So, when I see many pundits pointing to the decline we experienced on Friday as being caused by the announcement that our President contracted the coronavirus, I simply view it as a catalyst to move the market in the manner in which it was predisposed to move at the close on Thursday, as you can see from our chart presented to our members on Thursday afternoon:
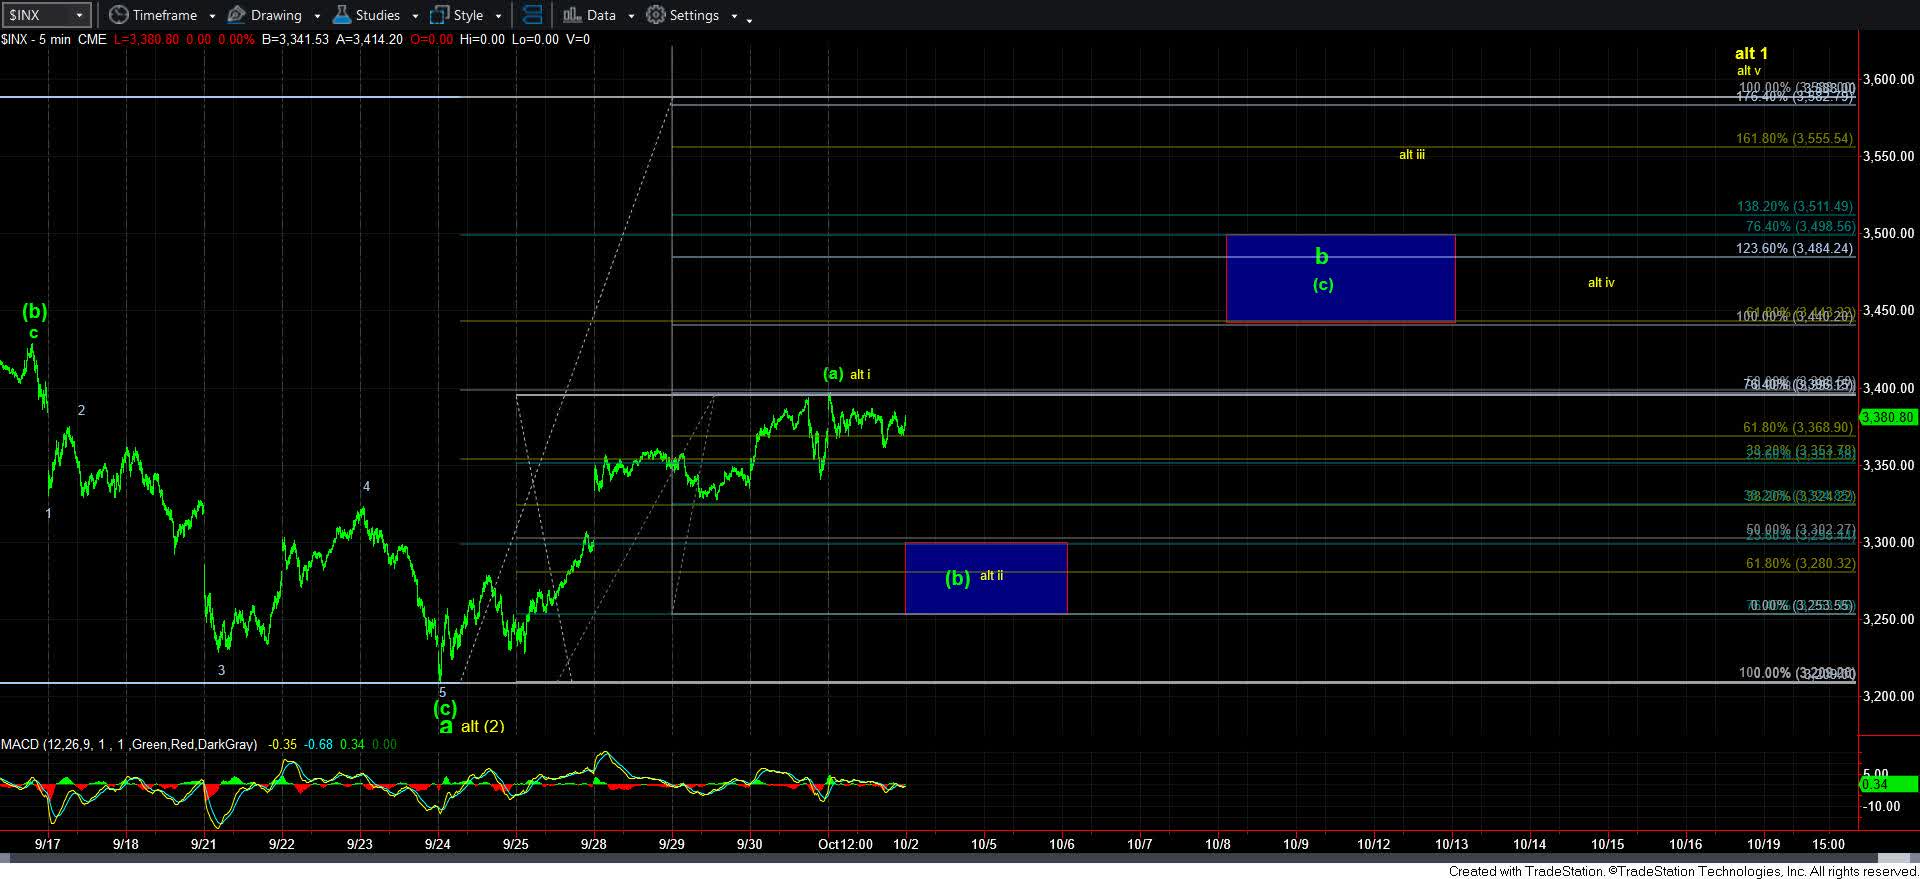
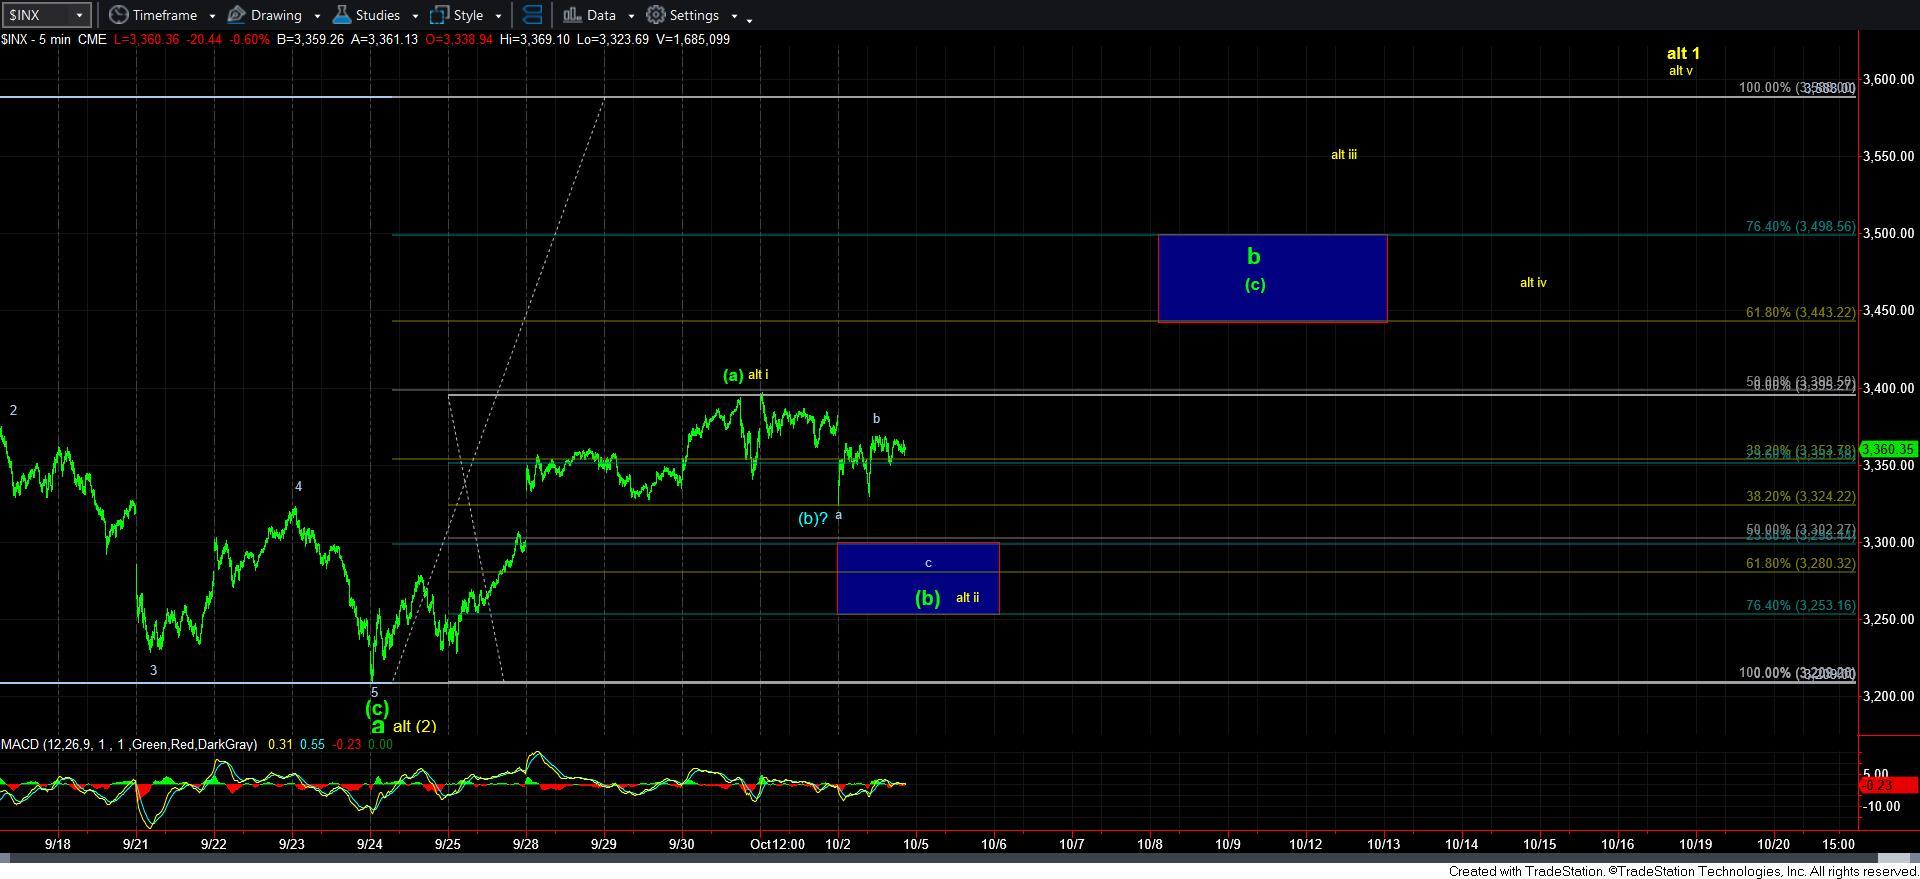
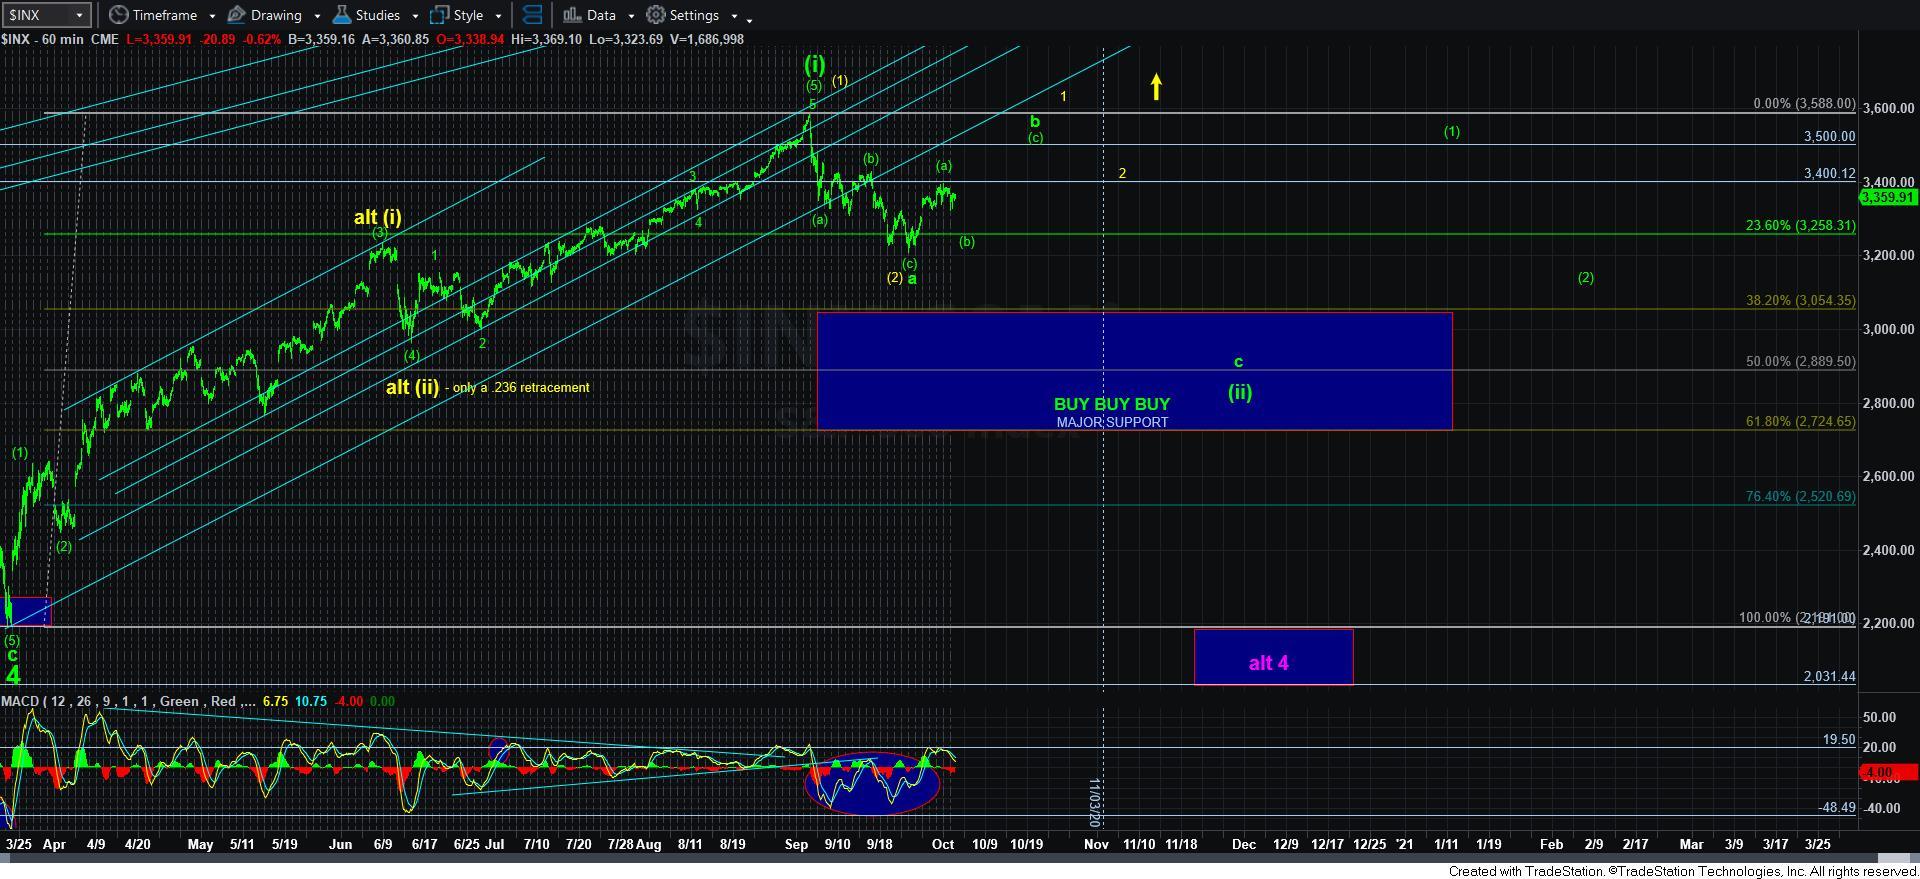
If you have been following my work of late, you would know that I expected a pullback from the 3,600SPX region to at least the 3,200SPX region. On the 24th of September, the market struck a low of 3,209SPX (yes, I missed by 9 points), and began the rally we experienced over the past week or so. And, as you can see from my chart above, as long as we hold the 3,250SSPX support, I am expecting a rally back up to the 3,450-3,500SPX region in the coming weeks.
But the manner in which the market handles the 3,450-3,500SPX resistance region will tell us a lot about how soon I expect to rally to the 4,000-4,250SPX region. If the market turns back down hard from that resistance in an impulsive 5-wave structure, then it means we will likely be pointing down towards at least the 3,050SPX region in the coming months before we begin the rally to 4,000-4,250SPX. However, if the market is able to follow the alternative path presented in yellow, which will take us back to the all-time high region, then it will only see a smaller pullback thereafter, and we will be on our way to 4,000-4,250SPX much sooner than I had initially expected.
So, needless to say, October is going to be very important in determining how soon the market is ready to attack the 4,000-4,250SPX region. My preference remains for a bigger pullback in the coming months, but I will let the market action in the next two weeks have final say on my decisions and actions.
See charts illustrating the wave counts on the S&P 500 (SPX).
Avi Gilburt is a widely followed Elliott Wave analyst and founder of ElliottWaveTrader.net, a live trading room featuring his analysis on the S&P 500, precious metals, oil & USD, plus a team of analysts covering a range of other markets.


