

This year will go down in history as one of the rarest and most volatile stock market (both to the downside and upside as well). We witnessed the fastest bear market in the 1st quarter and the quickest recovery in the 3rd quarter, states Joon Choi of Signal Alert Asset Management.
There were quite a few stocks with three-digit year-to-date returns, such as Tesla (600%), and even some four-digit gainers; +1,150% for NIO (Chinese electric-car maker). 2020 was clearly a traders’ market as there were many opportunities to make large gains (both long and short) if you did not shun from volatility. In our last issue, Dr. Appel mentioned that SPLV (a low-volatility ETF) may offer better opportunities than SPDR S&P 500 (SPY) as the former may catch up to the technology-heavy SPY. In this article, I will discuss SPHB’s (a high-volatility ETF) historic performance versus its low volatility counterpart, Invesco S&P 500 Low Volatility ETF (SPLV).
Overview of SPHB and SPLV
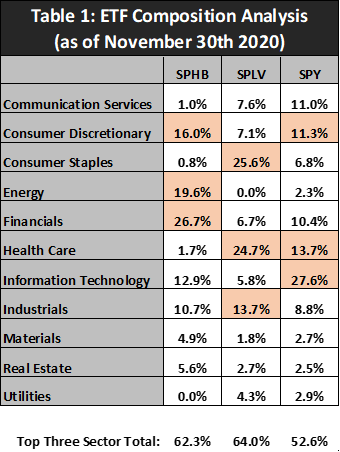
In May 2011, Invesco launched two ETFs on the opposite end of the volatility spectrum among the S&P 500 Index members. SPLV consists of 100 stocks with the lowest volatility in the SPX and SPHB is made up with 100 of the highest volatile stocks. They are both rebalanced quarterly, but the ETFs have very different composition (Table 1). Financial stocks make up 26.7% of SPHB along with 19.6% in energy and 16% in discretionary, totaling 62.3% in the top three sectors. Whereas consumer staples is the top weighting for SPLV (25.6%) followed by healthcare and industrial; 24.7% and 13.7% respectively. Information Technology represents the highest weighting for SPY (27.6%) as its top 5 holdings are all mega-cap tech stocks: making up 22% of the ETF.
Performance Comparison
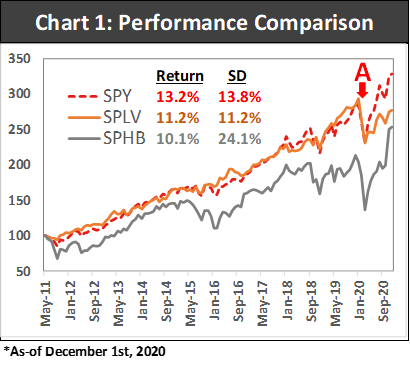
SPLV had similar returns compared to SPY since its inception in 2011 (but with lower volatility) prior to the coronavirus pandemic (Point A in Chart 1). However, the ETF experienced a similar selloff in February to March but did not bounce back as well as SPY, which is the primary reason it is trailing SPY by 2% a year (11.2% vs. 13.2% respectively). On the other hand, SPHB not only was the worst performer with 10.1% annual return but also had the highest annualized standard deviation of 24.1% (vs. 13.8% for SPY). On the surface, why even bother with SPHB if it returned less with more volatility? But as we dig deeper, this ETF may be used as a vehicle to add performance to your portfolio in the future.
As shown in Chart 2, SPHB/SPLV relative strength has been trending downward in a channel reaching the lower channel in March. Since then, SPHB has outperformed SPLV by 66% (86% vs. 20% respectively) while penetrating the upper channel, approaching 2014 highs. Moreover, the ETF is up 18.8% year-to date compared to -2.7% for SPLV.
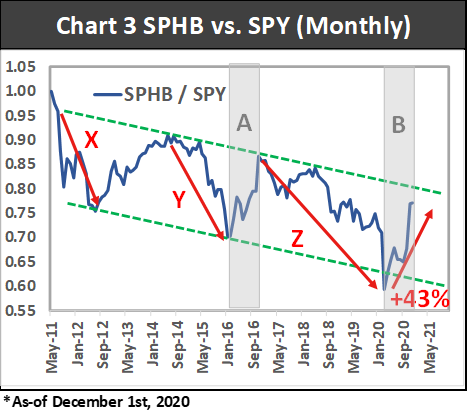
Chart 2 reveals that the relative strength of SPHB/SPY has also been trending down in a trading channel. The ratio penetrated the lower channel in March but has returned 43% more than SPY since its relative-strength bottom. Note that the current outperformance (Shade B in Chart 3, below) is very similar to 2016 (Shade A) when the ratio rose 0.17 versus its recent rise of 0.18. This may suggest that the outperformance may be coming to an end, however the relative strength has not reached the upper channel; indicating that there may be some more relative upside left.
Lower Volatility May Be in Fashion in 2021
As SPHB/SPY relative strength nears its upper channel in the coming month(s), it may be prudent to rotate out of SPY and/or high-volatile stocks to lower-volatility counterparts, such as SPLV (not yet, but in 2021). Table 2 summarizes the ETFs’ performances when SPHB weakened versus SPY during the three periods (Points X, Y, and Z). SPLV has had the best returns with 17.9% on average followed by SPY with 12%, while SPHB recorded double digit losses on all occasions with a -16.6% average. I will continue to monitor the SPHB’s relative performance to SPY and keep you updated on any significant developments. Lastly, please do not hesitate to reach out to me if you have any questions or comments on this writing.
To learn more about Joon Choi, please visit Signal Alert Asset Management.


