

Yesterday’s close on the S&P 500 (SPX) was almost a point higher than Monday’s close, confirming this market is shuffling sideways and not pulling back, states Ian Murphy of MurphyTrading.com.
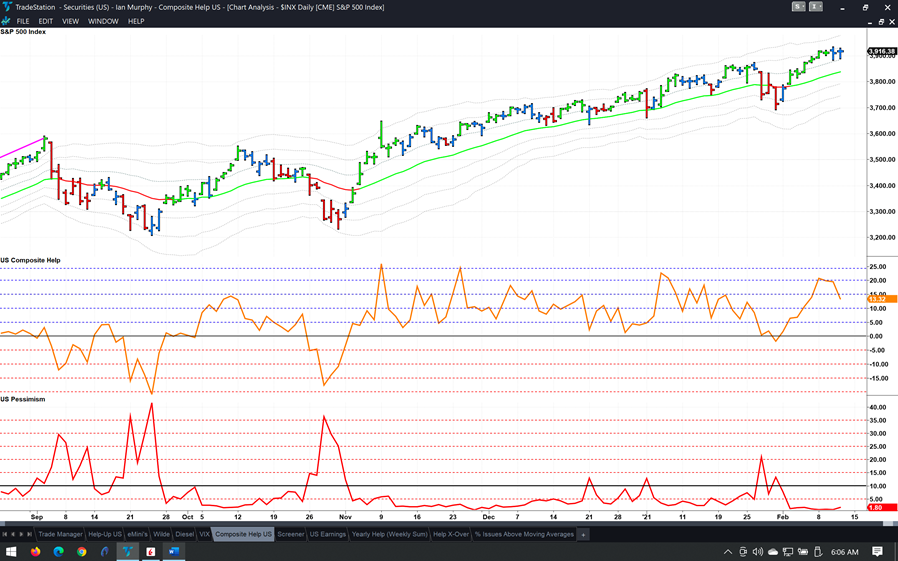
Also, the Pessimism indicator which counts the percentage of all US equities making a new 20-day low (red line on the bottom) has only risen to 1.8%. So long as this stays below 10% the US equity market will keep going up. Finally, note the color of the price bars. These will turn red on a pullback and they are still blue.
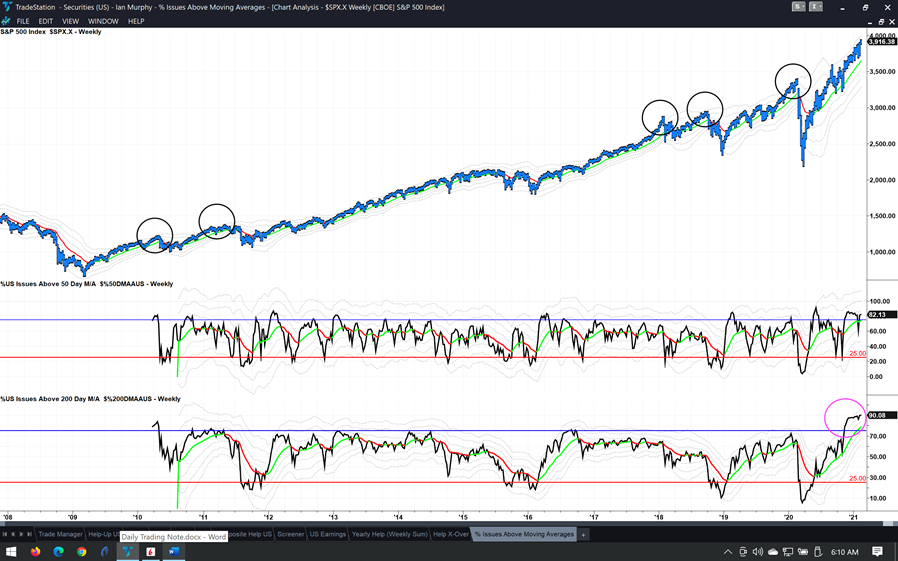
In fact, over 90% of US stocks are trading above their 200-day moving average (black line on the bottom). This indicator has also pierced its 3ATR line for the first time since 2010 (pink circle) when data from TradeStation began. 4000 on the S&P 500 looks possible in the coming weeks and this level coincides with the 3ATR line on a weekly chart which is historically overbought territory for the index (black circles).
Learn more about Ian Murphy at MurphyTrading.com.


