

The Federal Reserve is clenched in a cage match with the bond market from which there is no escape for them or for the markets, states Joe Duarte of In the Money Options.
Point in fact were the technical sell signals in the major indices and the increasing weakness in the market’s breadth as I detail below.
Indeed, the strange relationship between rising bond yields and rising stock prices may have finally been broken returning the markets to the traditional entanglement where rising bond yields are a negative for stocks. Still, despite the short-term pullback in yields, the long-term trend for bond yields remains up and the stock market, although weakened, is still not completely in sell territory, although that could change in a hurry.
So, what’s the bottom line? The Fed is either going to have to step up its bond buying to lower rates, or they will be forced to raise interest rates in order to slow the stealth inflationary pressures that are apparent in the real world, as in grocery and gasoline prices. Certainly, given the drop in yields over the last two trading days last week, the central banks might have already fired their initial salvo.
Unfortunately, unless something dramatic happens, such as an overnight and massive recession materializing, it’s a no-win situation for the Fed and for the markets; for increasing bond purchases will require an increase in QE and will be seen as fanning inflation. Meanwhile raising rates after promising that they won’t do so until 2023 makes the Fed an unreliable partner to the markets potentially causing a major debacle in stocks.
More Messy Markets Likely Ahead
Last week while describing the relationship between bond yields and stocks I noted: “what happens in the next few days and weeks may well define what happens over the next few months in this important and newly redefined intermarket relationship. Stay tuned.”
Furthermore, I wrote: “the rising trend in yields may be nearing a period of consolidation. We may even see a dip below the now important support levels—that were once resistance. But it remains to be seen whether this simultaneous uptrend in bond yields and stocks can be deterred without intervention from the Federal Reserve.”
I also sounded a note of caution about the stock market, noting: “this is a highly unnatural market relationship, which means that although we are trading it on the long side, we should not trust it. What I’m saying is that even as the market may make new highs from here as bond money moves into stocks, the odds of a correction in stocks are likely to rise as this strange phenomenon continues. It’s more of a matter of when than if.”
In fact, what happened on Wednesday, Thursday, and Friday of last week suggests that the stock and bond markets came to the same conclusion. This was especially noticeable in the relationship between the US Ten-Year Note yield (TNX) and the homebuilder stocks. Here is a summary:
- Fed chief Powell in his testimony to Congress continued to voice his doubts about the economic recovery and inflation on Wednesday.
- As Powell spoke the US Ten-Year note yield retraced the intraday yield highs it had made above the 1.40% early in the day closing below this key chart point.
- Along with Powell’s testimony home sales made new highs on Wednesday but new mortgage applications crashed simultaneously suggesting housing activity may have topped.
- This was confirmed when pending home sales were down on Thursday.
- And after a huge rally in stocks on 2/24 rising bond yields finally exploded above 1.5% and brought down stocks.
- Finally, by week’s end, bond yields retreated suggesting that the Fed might have intervened, but few stocks were able to recover.
Indeed, what that sequence of events told us is that the 1.4-15% area on TNX is the line in the sand for stock traders. Moreover, it suggests that bond yields may have now reached the point at which the housing market is starting to feel the negative effects as 30-year mortgage rates were in the 3% range and are likely to climb in the next few weeks barring something dramatic from the Fed.
Meanwhile Fed Chairman Powell continued to signal that the Fed’s easy money QE policy is not likely to change until 2023. So, the real question is what will happen if and when the inflation in real life begins to accelerate beyond the point in which the Fed can’t cite its own inflation measures, which do not account for many real-life prices such as those for buying (not renting) a home and food prices as the reason for continuing QE.
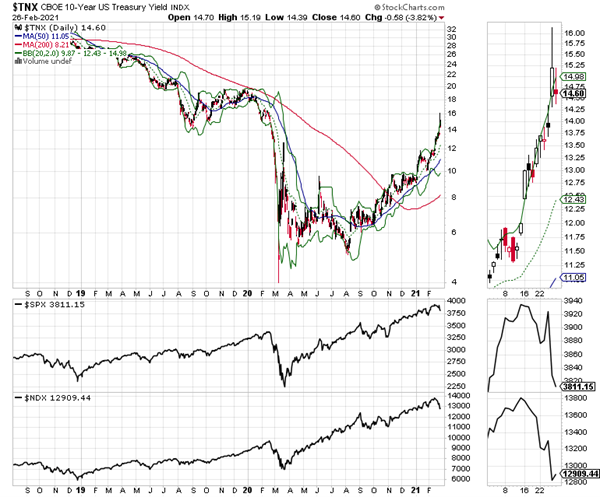
And in case anyone doubts it, the spell has been broken as rising bond yields are now doing what they were designed to do, cause stock traders to sell as they consider moving money back into bonds. The problem is that bond yields may still have a way to go to the upside before it’s a good idea to buy into the bond market.
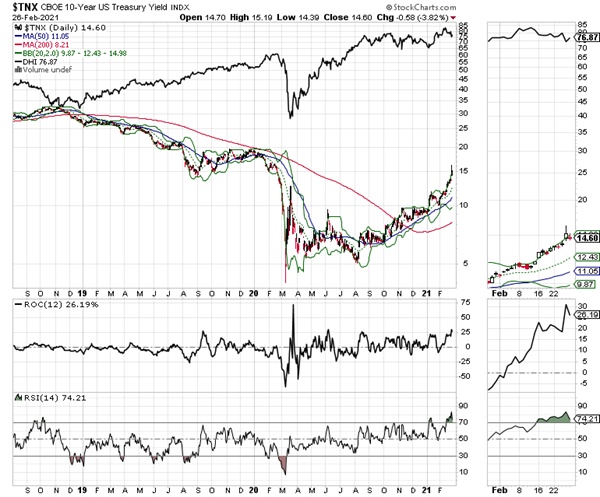
In addition, the inverse relationship between stocks and bond yields is very much alive regarding the housing stocks as we can see in the chart relating TNX to homebuilder DR Horton (DHI) (upper linear graph). Notice DHI’s long consolidation as TNX rose. Also notice that as TNX pulled back inside the upper Bollinger Band DHI shares began to nudge higher.
Applied Industrial Technologies: A Cyclical Diamond in the Rough for a Post-COVID World
The market’s leadership has changed of late in response to rising bond yields. And notwithstanding last week’s bond market volatility, the premise that shares of smaller stocks in the industrial complex may still benefit from an economic recovery remains viable until proven otherwise. As a result, it makes sense to examine engineering materials and solutions company Applied Industrial Technologies (AIT), a $3.4 billion market-cap company, which is quietly gaining a nice foothold in a market that is betting on an economic recovery.
As is the case with many small to midsize industrial companies, AIT is not a household name. However, its business is becoming increasingly crucial as the Post-COVID dynamic evolves.
First, it’s important to understand how ATI fits into the so called “recovery.” And to do so we must look at its product mix, which ranges from fluid control systems and robotic systems repair and installation to seemingly mundane things like hoses. Sure, not the sexiest of things; unless you’re trying to manufacture vaccines or repair the frozen motor or valves in your recently frozen wind turbines or oil and natural gas derricks.
In fact, as the company stated in its most recent earnings call, it’s noting an increase in demand for its services in key industrial areas such as chemicals, aggregates, paper, lumber, and energy. All of these are signs that the industrial and manufacturing sector is starting to awaken, at least in the US.
Moreover, although the company’s sales have not turned positive year over year yet since the start of the pandemic, its free cash flow, net income, and market share are all positive year over year. Even better is the fact that the company is starting to see increasing demand for its businesses in the 5G, vaccine production, and robotics business.
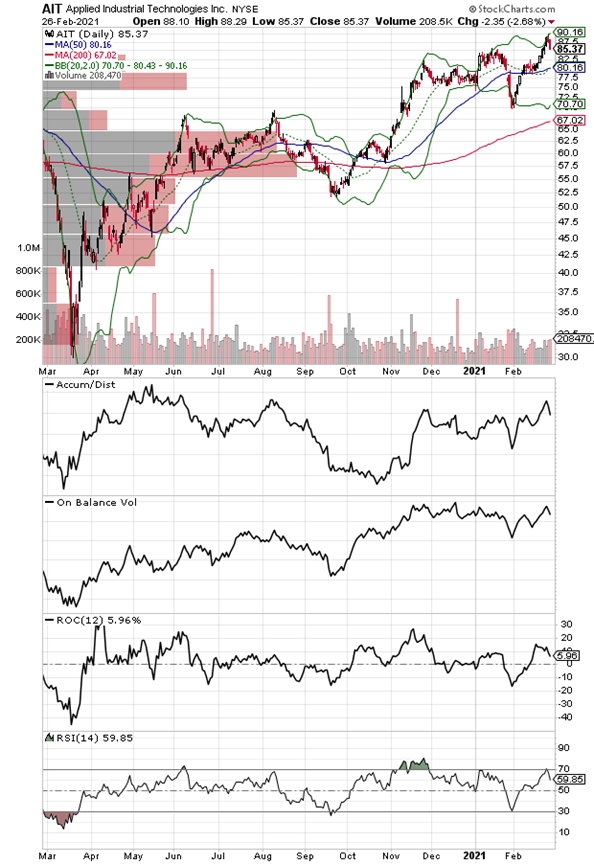
The price chart certainly tells a compelling story as the stock recently broke out of an extended base on big volume, which confirms the positive Accumulation Distribution (ADI) and On-Balance Volume (OBV). Furthermore, there is very little price resistance above the breakout point as illustrated by the Volume by Price (VBP) indicator.
Indeed, from this vantage point, it looks as if AIT is joining the ranks of industrial and engineering companies whose futures are improving as the world looks to emerge from the COVID nightmare. Finally, in the current market it makes sense to see how the shares fare in response to the evolving volatility. However, as long as AIT remains above its 50-day moving average it is worth considering.
Market Breadth Nears Sell Signal and Major Indexes Deliver Short Term Breakdown
The New York Stock Exchange Advance Decline line (NYAD) almost delivered a new high on 2/24/21 but failed in the attempt just one day before the dam burst on bond yields. This is clearly a sign of weakness for the uptrend. Therefore, caution is warranted.
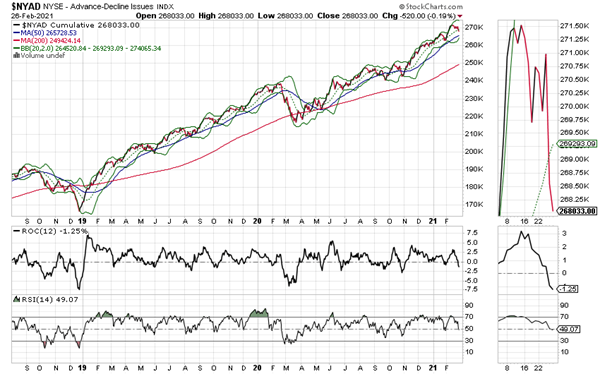
What that means is that we now have to pay special attention to key NYAD chart points in order to see what comes next. Specifically, consider that as long as NYAD continues to make new highs, remains above its 50- and 200-day moving averages and its corresponding RSI reading remains above 50, the trend is up. This combined set of observations has been extremely reliable since 2016.
That said, the way things ended last week leaves us in limbo as RSI closed right at 50 and NYAD crashed through its 20-day, but not its 50-day moving average. The most recent two similar situations resolved to the upside, but patience is a virtue here.
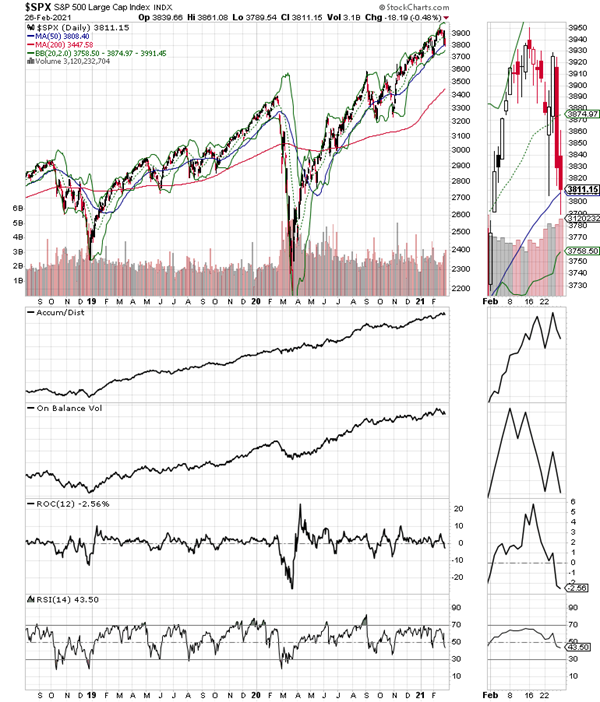
For their part, the S&P 500 (SPX) and the Nasdaq 100 (NDX) rolled over midweek, in response to the volatility in the bond market. Moreover, NDX broke below its 50-day moving average and is near the 30 area on RSI, which would make it oversold. SPX remained above its 50-day moving average but is also trading below 50 on RSI.
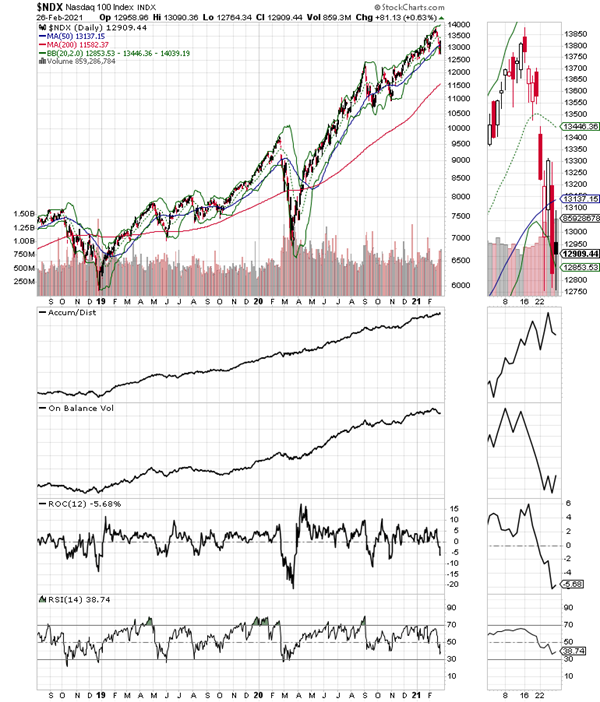
The bottom line, though, is that if this pullback is similar to recent pullbacks, because of the aggressive selling in the indices, much of the selling may be nearing its conclusion. If this is true, then the RSI 50 area for NYAD will provide support and the uptrend will resume. A failure of the NYAD would confirm the sell signal in NDX and likely lead to further selling for the entire market.
Next Move in Stocks is Anyone’s Guess
The volatility in bond yields seems to be creating confusion in the stock market, which means that trading may be difficult in the next few weeks as things sort out. That said, in a market ruled by artificial intelligence algos and still fueled by QE from global central banks the current confusion may be over as quickly as it started.
In other words, the best way to manage this market is to stick with sound trading rules and watch each individual position as it relates to the general trend in the market.
To learn more about Joe Duarte, please visit JoeDuarteintheMoneyOptions.com.


