

Yesterday’s low on the S&P 500 (SPX) was 5.75% below the recent high, putting the index officially in a pullback, states Ian Murphy of MurphyTrading.com.
There have been regular pauses for breath since November, but this week’s price action is different for a few reasons.
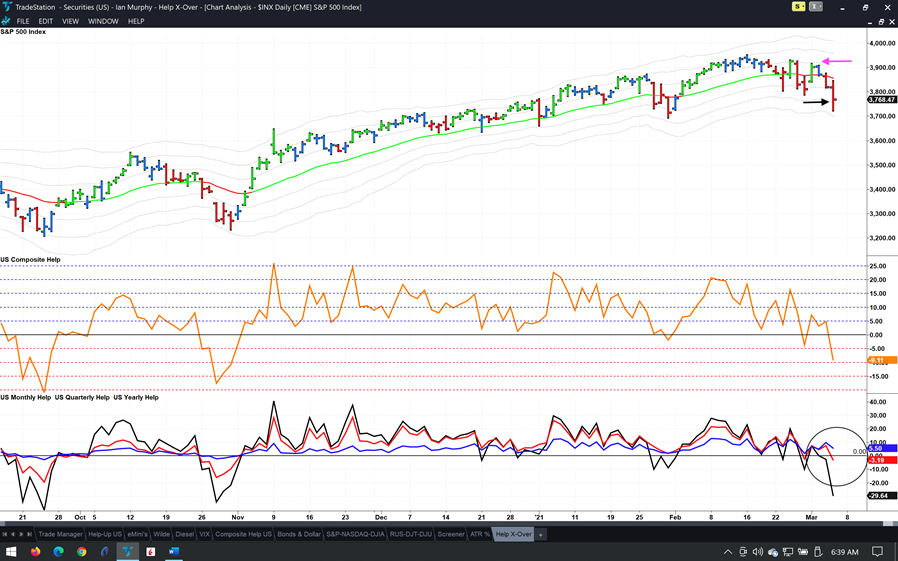
Firstly, the index traded below the -2ATR line (black arrow) which hasn’t happened since October. Second, the index met resistance twice at the 1ATR line (pink arrow) and formed a first lower high in the process, a pattern not seen since September. And third, Composite Help crossed over the zero line twice in five sessions (orange indicator in the middle).
Drilling down into Composite, we can see why. New quarterly highs less lows (red line on the bottom chart) have also crossed zero twice, leaving just yearly data in positive territory. These are classic signs of a trend change.
Monday’s trigger in the US Help strategy was stopped out on both instruments (red dashed lines above). In my personal account the tighter stop at 3850 on Micro E-Mini futures (CME: MES) as shared in Wednesday’s note, did its job and I was stopped out during the day for a small loss. Now we wait for the next trigger, and the stronger the selloff the more likely the follow up bounce will be profitable.
Nonfarm payrolls came out at 08:30 ET today and the extreme levels in bonds, oil, and gold (as identified in the March newsletter) have continued. Realized volatility has also picked up across the board. Before the open in the US, ensure protective stops are in place and active.
Learn more about Ian Murphy at MurphyTrading.com.


