

After last week’s substantial move in yields, anxieties regarding longer term inflation have entered the spotlight, states Garrett DeSimone, Ph.D of OptionMetrics.
The Fed’s easy-money policies and government stimulus spending have juiced growth and momentum into an epic bull run over the last year. However, these equity factors now face substantial risks from bond market volatility.
Often underappreciated, implied treasury volatility (TVOL) measures uncertainty reflected in the options prices on 10-year yields. This implied volatility impounds all kinds of valuable economic information like inflation expectations, unemployment, and the direction of monetary policy.
Increases in TVOL are negatively related to aggregate market returns, as rate uncertainty causes equities to be riskier through the discount component of future cash flows. The graph below demonstrates the relationship between aggregate market returns and change in 10-year treasury volatility. All measures of TVOL are extracted from at-the-money futures options located on the OptionMetrics volatility surface.
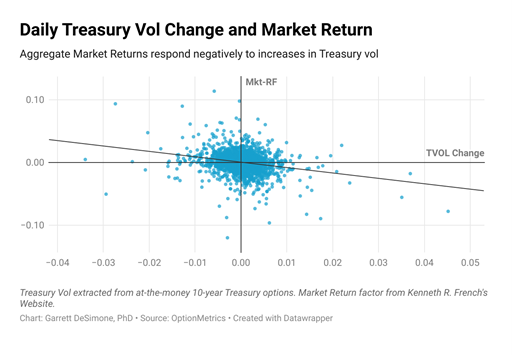
It is evident that a rise in TVOL causes real headwinds for the broader equity market. However, we should not expect rate uncertainty to impact all stocks equally. Financial theory tells us sectors should have differing exposure to interest rate changes, namely growth and value. Growth stocks are anticipated to have larger cash flows in the future, therefore, rising rates should squeeze their valuations. 90-day rolling correlations are plotted for low Book-to-Market (B/M), or growth, and high B/M, or value, returns and TVOL changes in the next graph.
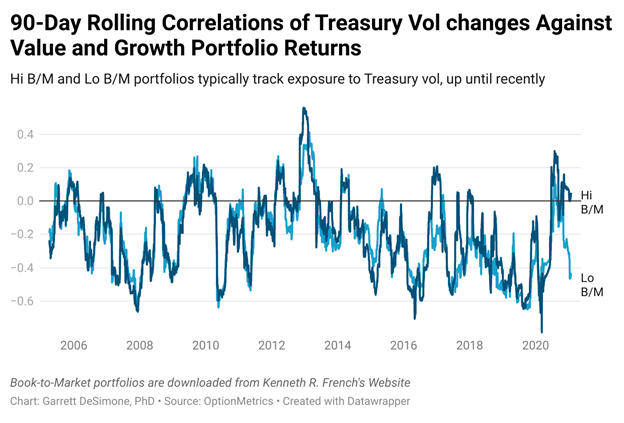
The sensitivities of growth and value to rates uncertainty track pretty closely to each other historically. However, growth and value exposures begin to diverge in a big way starting in 2021. While the high B/M portfolio has close to zero correlation to TVOL at the end of January, the Lo B/M stocks exhibit strong negative sensitivity near -0.5. Therefore, rises in TVOL impose much stronger losses on growth compared to value.
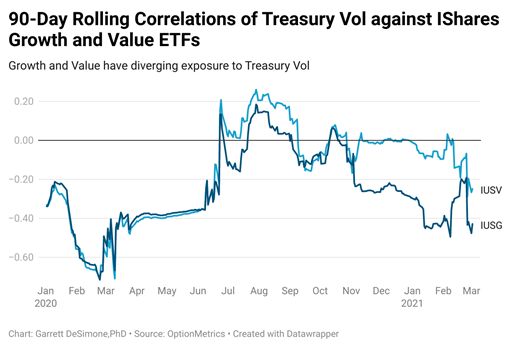
To support this notion, I provide a similar graph using tradeable portfolios, the IShares Growth and Value ETF (IUSG and IUSV). Again, we highlight the major divergence in correlations between the two ETFs beginning in late 2020. IUSV maintains near zero exposure, while IUSG becomes significantly more negatively correlated to vol movements.
Tech and growth have become increasingly risky in the face of a steepening yield environment. If yields continue to rise on upbeat economic data, there is a strong possibility a significant sector rotation will occur, with value (finally) yielding outperformance. Additionally, we expect much higher sector churning across sectors with decreased stock correlations. As for the trigger, one may look no further than the hard economic data, which lie in the monthly reported CPI and unemployment numbers.
Learn more about Garrett DeSimone at OptionsMetrics.com


