

I’ve presented several scenarios for March, and thus far, they all seem to be working. They are working not due to any super forecasting skills on my part, explains Jeff Greenblatt of Lucas Wave International.
It’s all due to a nasty divergence developing in the stock market. Recently I said the market would be in big trouble if the NASDAQ-100 (NDX) broke down from its 233-day low. I also said the door was wide open to another rally with a theme of buying the prospect of the $1.9 trillion stimulus package, which is a go.
Since they bought the rumor, the only question left as we head into the most interesting cycle points of the entire year is whether they will sell the news. As of this writing, the goal was for Biden to sign it prior to the 14th so unemployment benefits would not expire. The next Fed meeting comes a week from now, and that time frame is very close to the annual Gann reset at the change of season. Taking the view from 30,000 feet, there is a reasonable chance for a reaction and profit-taking at the very least a week from now. That doesn’t consider the NASDAQ’s big Tuesday or the fact it's miles from its high while the Dow is already at a new high.
While all this materialized, the US dollar stalled at a very key point in the development of this bounce. You are looking at the long-term channel lines dating back to the top, which is now already a year ago. The greenback has been in a bear market for a full year. For those of you who recall my comparison a year ago to the corn chart from last decade when the dollar peaked at the 144-month high right at the annual Gann reset, this shouldn’t surprise anyone. When corn peaked at its 144-month high in 2012, it promptly dropped over 60% in the next two years. Right now, the leg to the low in January dropped 14%. Since markets are non-linear, the greenback is following in corn’s footsteps.
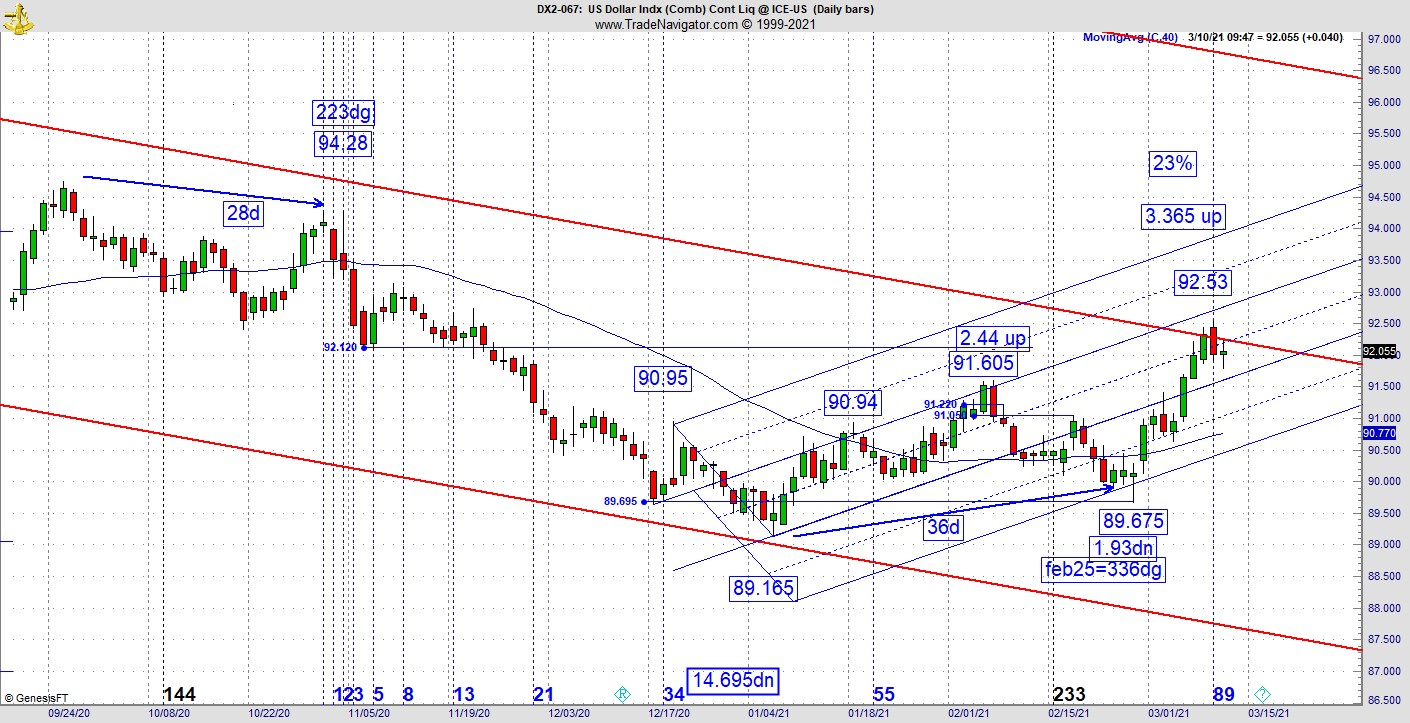
Is it a lock the greenback starts dropping? No, but there are some interesting relationships lining up that could gain the reaction. Let’s take a look. For those of you looking at this for the first time, we use prior relationships as a harbinger for what could come because the market practices a tendency, I call replication. That means the same numbers repeat over and over but in different ways. For instance, this latest bounce commenced on February 25 which is the 336dg vibrational day on the Gann calendar. That pivot materialized 36 days off the bottom. Now the bounce is 3.365 (36 vibration repeated) up. From the top this is a 23% retracement while the prior high on November 4 was the 223dg vibration day on the Gann calendar.
If you are looking at this for the first time, the 23% retracement by itself means very little. But when you look to the 223 vibrational day, this might mean something. Then consider where we are in the pattern. Its right on the midline, which is a good place for it to fail if its going to fail. What is the big deal with the channel midline? It’s a down channel but the path of least resistance is surely down in the lower portion while bearish activity will hit a headwind if it survives this test. If it survives, it's likely to have a period of consolidation around the line before it potentially extends the rally to the upper channel line.
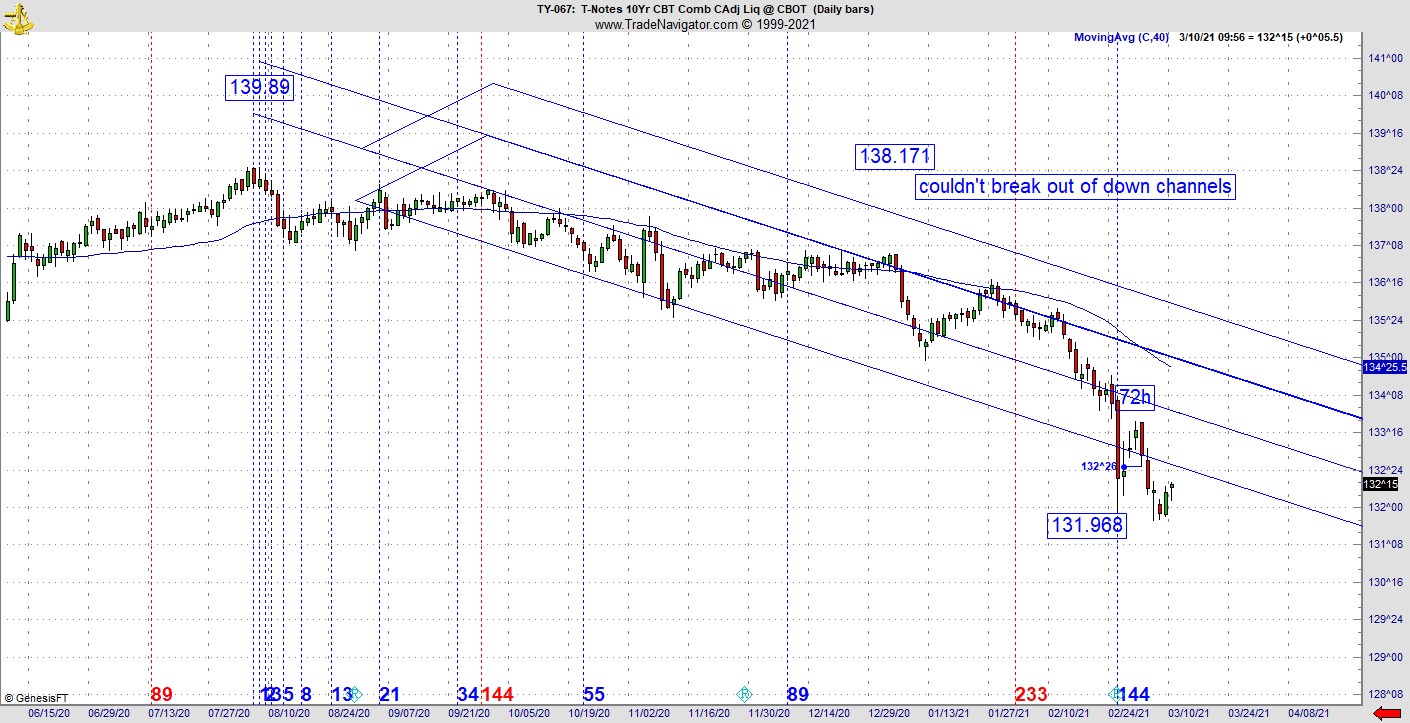
As far as the 10-year is concerned, it took out its 144-day low marginally but still looks like it’s in trouble as there are lots of overhead resistance.
I always work at finding vibrational relationships nobody realizes is there but once you get the revelation it affords you an incredibly good edge. In this case there was an interesting sell the bounce sequence the other day on the one-minute E-Micro. In this situation take the confluence of the channel and our vibrational work. Look at the bottom and secondary low pivot. The time stamps are :46 and :05 for a total of 19 minutes. Now look at the high before the high and the top.
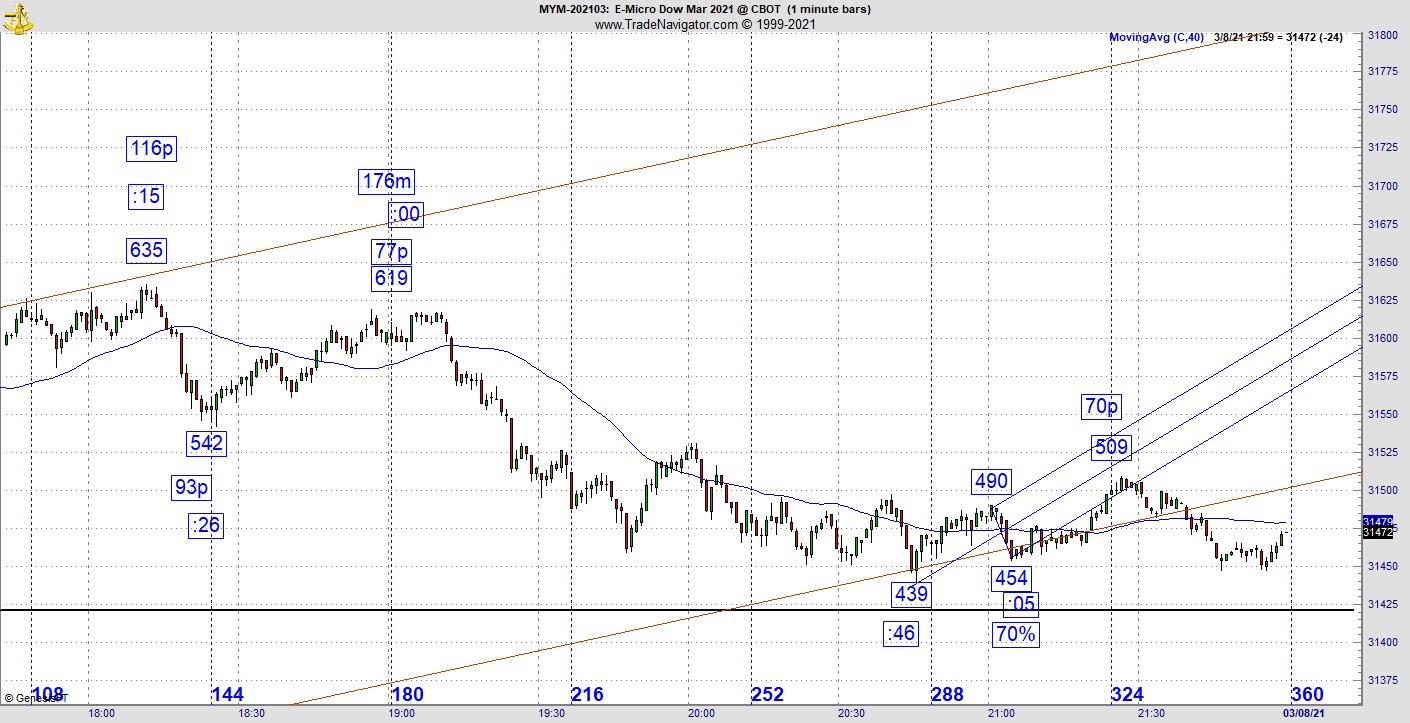
The difference is 19 points! Keep in mind what I’ve found on a one-minute chart will repeat on other charts in other time frames with adjustments away from 1 minute world. This is not a coincidence and you can see it quickly falls out the channel for a fresh leg lower. Once again, the 19-point differential means very little unless you are aware of what came before.
Think of the market as a novel. Something you read on page 50 might not pay off until page 150 or 250. Financial markets work exactly the same way. It takes a lot of practice to pull this off, but the first step is being aware these tendencies exist and manifest every single day.
Here’s the bottom line. It’s especially important for the trader to know when their edge appears. If you are trading at any other time it would be a good idea to rent the ’21’ movie. Pay close attention to the scene where non-linear professor Mickey Rosa (played by Kevin Spacey) taught the protagonist Ben Campbell that if he were to play without the right count, he would be gambling. Many aspiring traders find this out the hard way.
Fore more information about Jeff Greenblatt, visit Lucaswaveinternational.com.


