

The recent selloff in tech stocks appears to support the popular narrative about a rotation from growth to value, or does it, asks Ian Murphy of MurphyTrading.com?
Stepping back from the volatility of a daily chart frequently provides valuable perspective when unsure of market conditions.
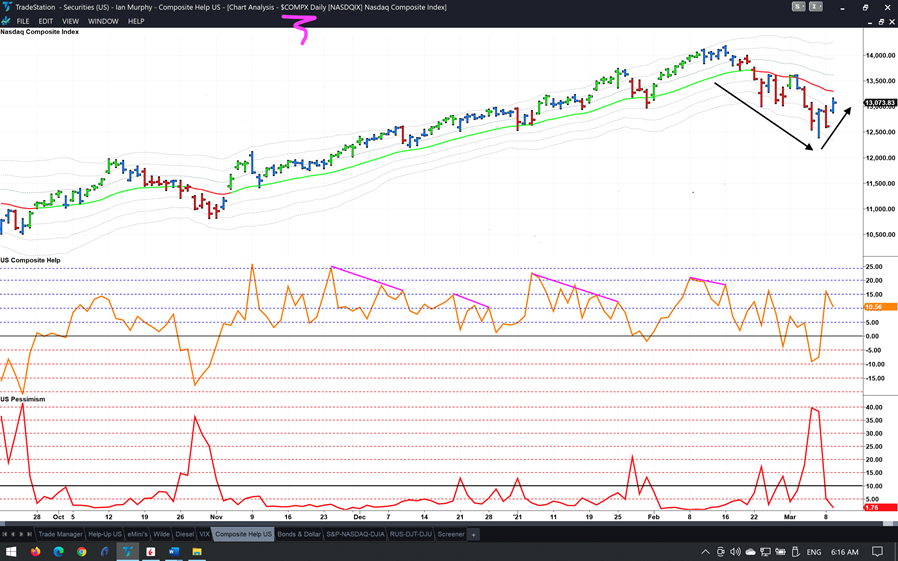
On the daily chart above the tech-heavy Nasdaq did indeed decline 12.5% from its February peak, but recovered 5.5% by yesterday’s close. It’s still trading below the declining 21EMAC and has just made it out of the bearish zone, so a little negative action will put it back in decline. That fits the narrative.
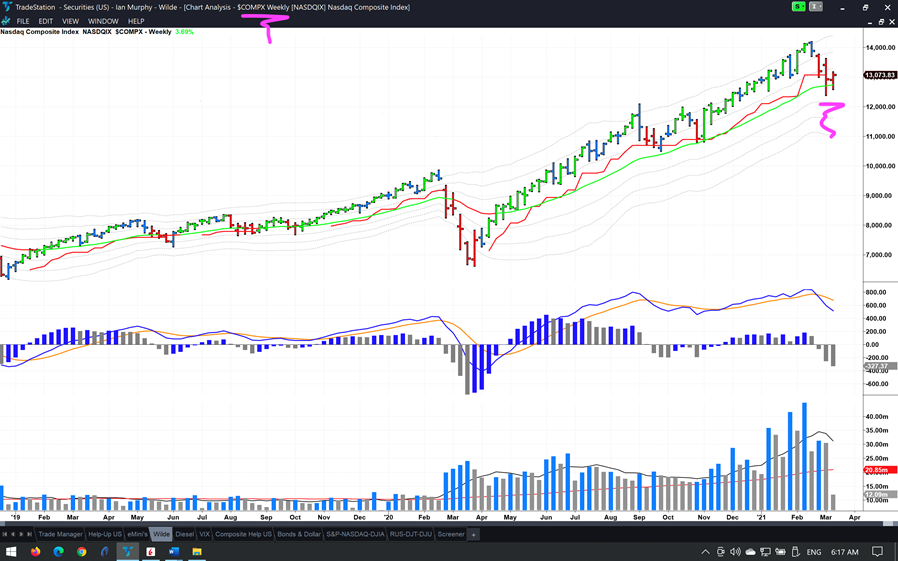
However, on a weekly chart the index pierced its 21EMAC, reversed and closed higher forming a two-bar-washout. If the Nasdaq closes above 12,920.15 on Friday afternoon, it will be a classic reentry trigger for a weekly trend-following trade after the trailing stop was hit on week ending Feb. 26.
As it stands, there is nothing on this chart to suggest the Nasdaq is bearish; in fact this is just a normal pullback to value at the rising moving average. Admittedly that could all change between here and Friday, but it would have to close below 12,175 to turn technically bearish.
Learn more about Ian Murphy at MurphyTrading.com.


