

The recent surge of the long-term interest rates (10-year Treasury yield rose from 0.92% to 1.64% this year) in the US was propelled by investors anticipating higher-than-expected inflation due to a quicker forecasted recovery from the current recession, states Joon Choi of Signal Alert Asset Management.
This has benefited value stocks, such as banks, and put pressure on growth stocks. For example, IVE (a S&P 500 Value ETF) outperformed IVW (a S&P 500 Growth ETF) by 7.4% in 2021: 8.4% vs. 1.0% respectively. iShares 20+ Year Treasury Bond ETF (TLT) has lost 12.5% this year and 19% since last August as interest rates marched up from their historical lows. Although some strategists foresee further rate hikes, I believe TLT provides an excellent opportunity for solid returns for the rest of 2021.
Overview of TLT
TLT holds long-term Treasury bonds ranging from 19 to 30-year maturity, which makes the ETF sensitive to interest rate fluctuations. Moreover, it has a three-year beta of -0.27 vs the S&P 500 Index; meaning that it is slightly negatively correlated to equities. However, if inflation is significantly higher than expected in the coming months then we could see a further rise in interest rates, which may in turn lead to losses in both TLT and equities.
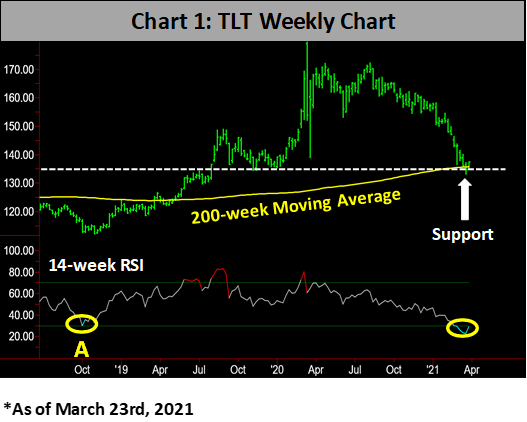
A rapid rise in long-term rates led to a sharp fall in TLT and recently found support at its 200-week moving average, which coincides with a strong horizontal support line (Chart 1). TLT’s 14-week RSI recently dipped below the oversold level (30%) and since turned up. This setup looks similar to October 2018 when the ETF formed a bottom after turning up from less than its 30% RSI level (Point A).
The Study
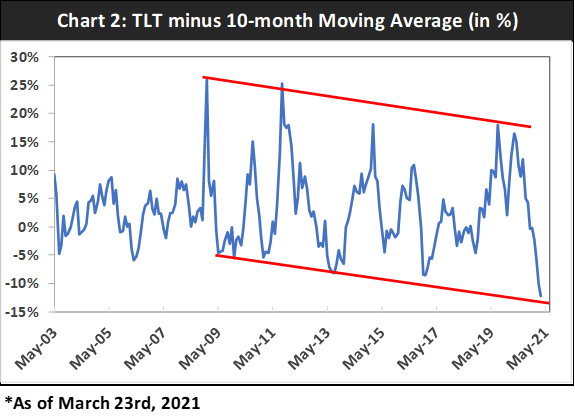
I gathered total-return monthly data for TLT since its inception in 2002 and created a 10-month simple moving average (10-SMA). Then I divided TLT’s price by the moving average and subtracted one to create a data stream of how far TLT is away from its 10-SMA in percent (Chart 2). The ETF is currently 12.2% below the 10 SMA and appears to be near the bottom of a channel that started in 2009. This is an indication that TLT may find a bottom soon as it is at its furthest point from its 10-SMA.
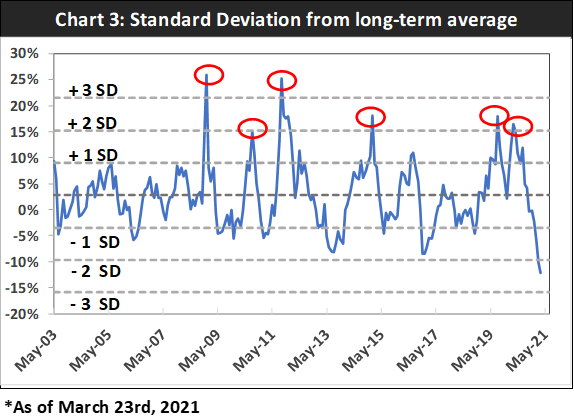
Next, I plotted TLT’s average deviation from its 10-SMA (2.8%) and calculated the standard deviations (SD) ranging from -3 SD to +3 SD. As evident in Chart 3, there are very few instances where the data point stretches past +2 SD (four occasions) and +3 SD (two occasions). The reversals from these extended levels were very sharp, indicating sharp TLT selloffs. Recent TLT weakness has led to the greatest separation below the moving average; below the -2 SD for the first time. This potentially indicates that a sharp reversal upward in bond prices (lower in interest rates) may be under way.
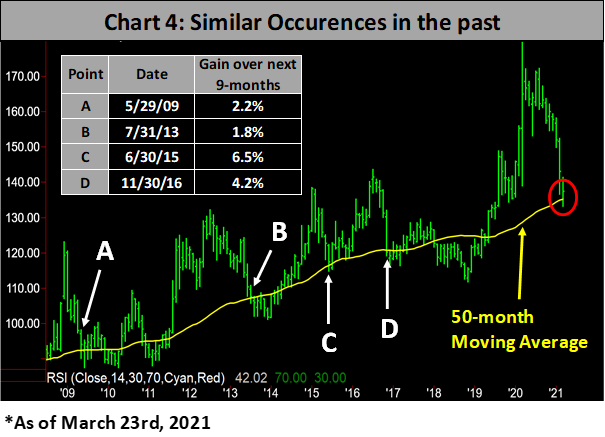
Since inception, there were four occasions where TLT sold off more than 15% from a peak and found support at its 50-month moving average (Chart 4). TLT also recently sold off more than 20% but stopped falling after briefly penetrating the moving average (depicted in red circle). Although TLT continued to fall more after its support three out of four occasions (point B being the exception), its prices were higher nine months later.
Recommendation
So, what is significant about nine months? Nine months from now happens to be near year end and I am recommending a TLT buy but only as a covered-call position to hedge against further selloff and bring in premium. As of March 23, a $140 call expiring in December was $2.51 out of the money with a $6.1 call premium. In addition, you will collect nine monthly dividends (approximately $2.27). The total potential profit of $10.88 or 7.9% is attractive especially when riskier bonds, such as high yield and floating bond funds, are yielding only 3-4% assuming no further price appreciation (meaning 2-3% additional income until year-end). In addition, higher interest rates may serve as a head wind for equities for the rest of the year and may not appreciate much more from current levels. TLT may drift a little from current levels but I believe this recommendation will capture the maximum profit by year-end.
To learn more about Joon Choi, please visit Signal Alert Asset Management.


