

Suddenly March is gone and so is the first quarter. In our work that means the Gann reset is done and we are upon the last big-time window for this sequence, explains Jeff Greenblatt of Lucas Wave International.
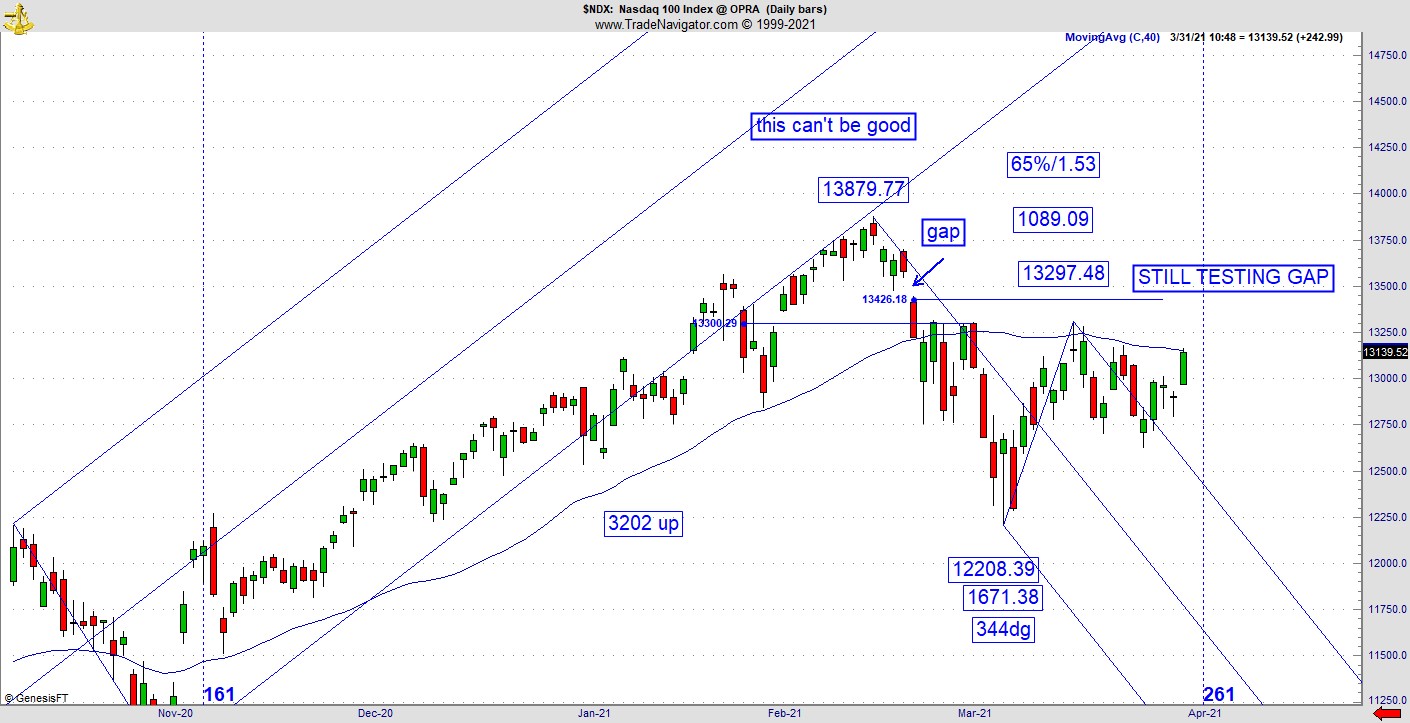
As you know, I’ve been watching out for a test of the original elusive gap down in the NASDAQ-100 (NDX). Since last week, the NDX hasn’t done much, and the test is still waiting.
Could it hit right on this 261 window? This is not a prediction, but risk is always higher during one of these windows and when the window appears, the news event manifests almost by magic. What could possibly happen to upset the market? This is not a topic anyone likes to discuss but we remember how cities burned last summer as a result of the George Floyd incident. Now the trial has started, legal experts believe the trial could end soon, perhaps by the end of the week. If that is the case, it will line up perfectly with this 261-day window. If they burn the market could turn.
The time window itself is not a point for prediction. Rather the correct way to look at these windows is to realize risk gets elevated because markets could turn by the time it gets to the other side. News events tend to materialize more often than not.
Elsewhere, the 161-day window on the Ten Year ultimately failed and the likely reason is I didn’t find any other 61 vibration for the pattern to grab. Here’s how I’ve found the golden spiral works in the world of timing cycles. If you compare a pattern to a poker game, each player has a chance to make their own hand, but they can be helped by ‘wild cards’ known as jokers. These patterns mostly turn on their own square out vibrations but are helped by these wild cards known as golden spiral relationships. That means a pattern can and will turn on a 61 vibration (.618, 1,618 and 2.618) without any collaborating 61 vibrations to add to the mix. The 61 golden spiral window does act similar to the wild card as it can change the direction of a pattern even on a temporary basis. In this case there wasn’t any other obvious 61 relationships, consequently it failed. Now the pattern is sitting near lows with the potential to get a fresh leg down.
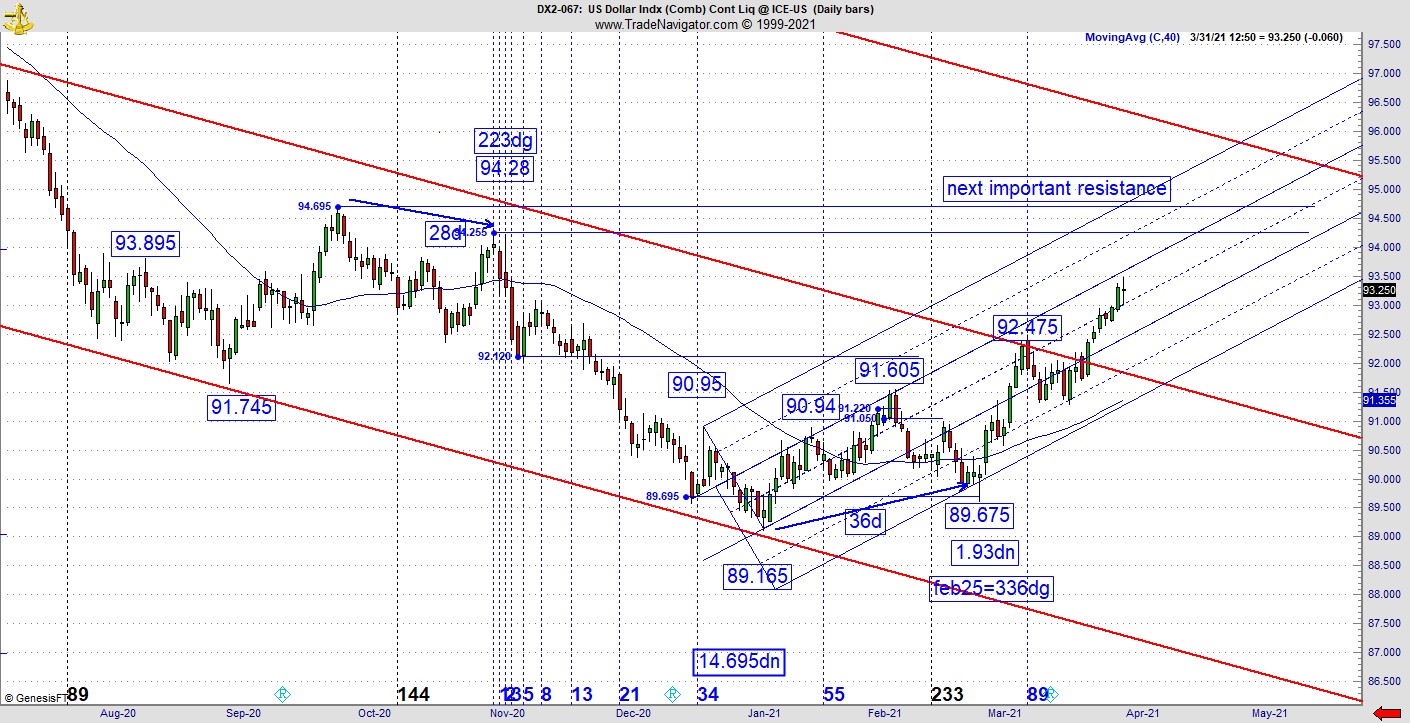
The exact opposite is going on at the US dollar, which has broken free from the midline of the channel and now the door is wide open to test the outer channel line of the bear market. As far as the greenback is concerned, the February 25th Gann calendar pivot at 336dg at the 36-day low to low window remains the gift that is still giving. The problem for greenback bears is we haven’t seen any vibration to line up that is as strong as that setup. In case you are wondering when the 36dg day of the year materializes, it is April 27. I’m not trying to find a needle in the haystack but if the greenback continues to the outer channel line, it is conceivable it could take another month to get up there. This is another reason to call the March seasonal change point as the Gann reset as each day of the year has a specific vibration that is tied to the 360dg orbit of the earth, which is calibrating to numerous vibration points throughout the year in all markets.
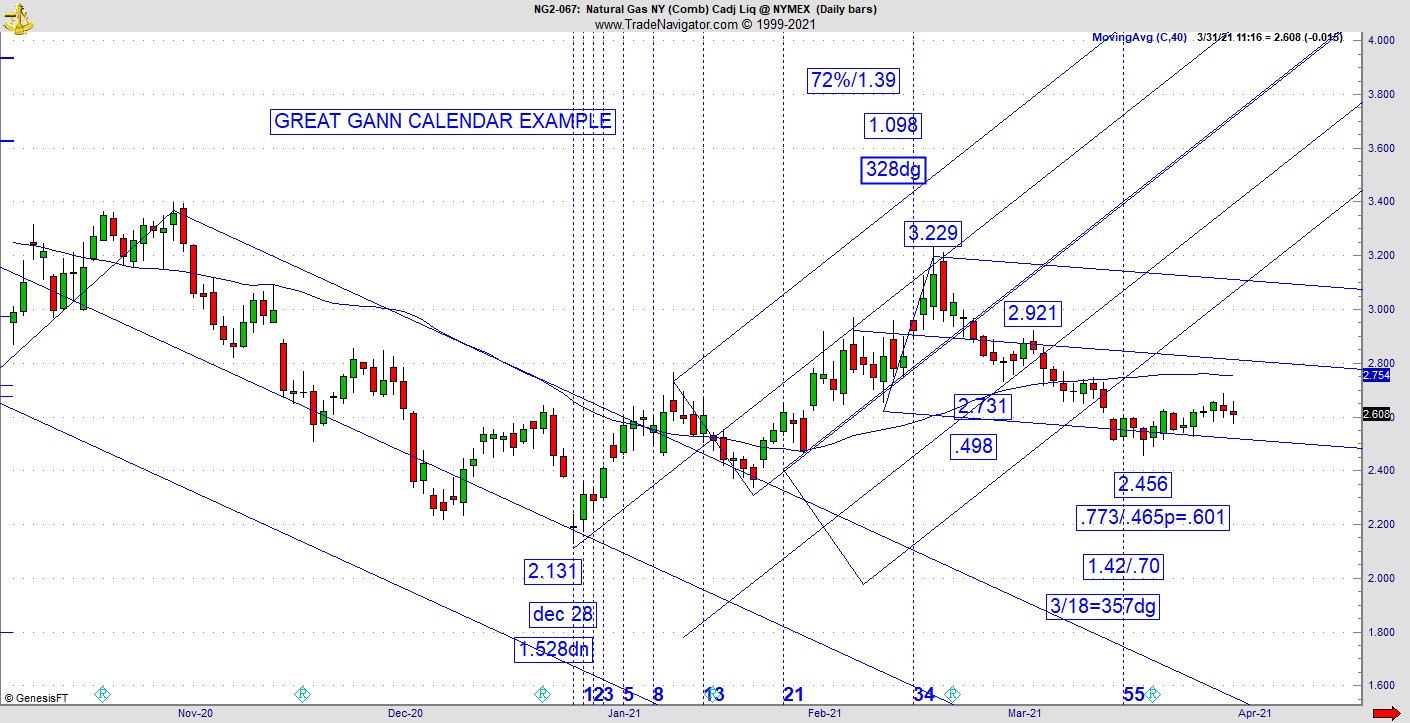
Finally, here’s an example of how the Gann calendar has worked recently on the nat gas chart. The high on February 17 was a 328dg day and on the continuation chart the high is 3.229. I don’t know how they calculate the rollover prices on continuation charts but somehow, they seem to tie together with the Gann calendar in many cases. In this case the high works at 328 and 3.229 but that’s not all. From the high, it stopped going down at the 357dg day which is 29dg down. That low at the 357dg day is also 57 days off the December bottom. Granted, this hasn’t been the greatest start but in the very least there is a reaction and its possible there could be more. As it turns out, the context of this sequence is such that it falls into a flattish channel, which slopes slightly lower. When looking at any reversal, always be aware of its positioning to important support or resistance.
Overall, in many years we’ll observe major clear-cut reversals in the action on many charts. We don’t see that yet this year as the patterns are sloppier than usual. For instance, the Dow made a high on March 18 while it traced out a quick low on March 25. Since it already made a new all time high, this is why we are looking to the next window coming up at the start of trading next week. If the 261 window doesn’t validate then we are likely looking at the biggest bubble in the history of the stock market.
For more information about Jeff Greenblatt, visit Lucaswaveinternational.com.


