

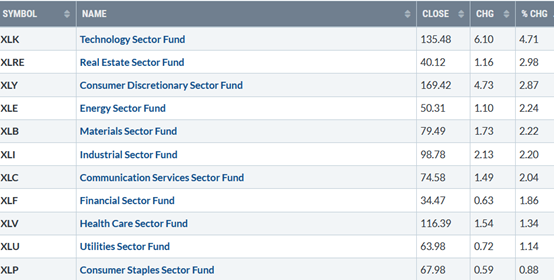
All eleven S&P sectors finished higher during the four-day holiday-shortened week ending 04/01/21, states Bonnie Gortler of bonniegortler.com.
Technology (XLK) came to life, leading the broad market higher. Real Estate (XLRE) continued to climb, +2.98% including 3/25. Utilities (XLU) and Consumer Staples (XLP), both defensive sectors, began to lose some of their recent strength, implying investors are willing to take on more risk. SPDR S&P 500 ETF Trust (SPY), in comparison, gained +1.17 % closed at a record high.
Source: Stockcharts.com
S&P SPDR SECTOR ETFs SUMMARY
March and January – March Performance
Source: LazyPortolioETF.com
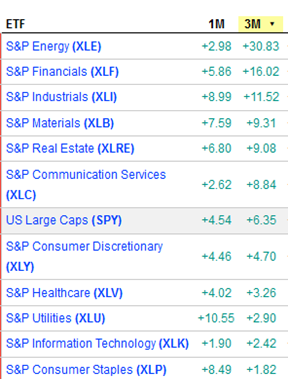
For March, all sectors were profitable. The best-performing sectors were Utilities, Industrials, and Consumer Staples. The laggards for the month were Communication Services (XLC) and Technology.
For the quarter (January-March), the best-performing sectors were Energy (XLE), Financials (XLF), and Industrials (XLI), while Technology and Consumer Staples were the weakest.
10-Year Treasury yields stabilized, closing at 1.679%, after reaching its highest level of the year at 1.746%. A close below 1.60 for two days would be a positive sign that rising rates may pause in the near term. On the other hand, if yields increase quickly, growth stocks are likely to fall and could ignite more selling in the broad market.
The Dow gained +0.24% for the week, the S&P 500 was up +1.14%, and the Nasdaq gained +2.60%, its second weekly gain in the past seven weeks. Market internals improved substantially last week. Weekly market breadth on the New York Stock Exchange Index was positive with 2212 advances and 1172 declines. Nasdaq breadth was positive with 2696 advances and 1578 declines. new lows on Nasdaq contracted again, falling from 88 to 24, an encouraging sign, the recent advance will continue.
It's not the situation, but whether we react (negative) or respond (positive) to the situation that's important. -Zig Ziglar
What to watch now?
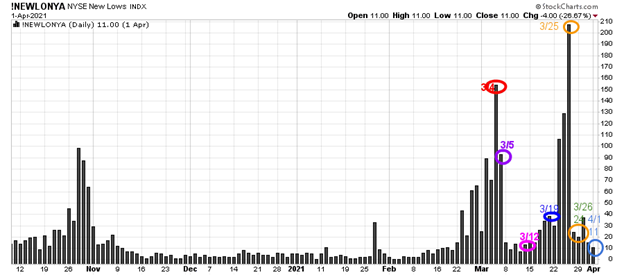
Figure 1: New York Stock Exchange new lows
Source: Stockcharts.com
On 3/25, the NYSE new lows were 207 (see Figure: 1), a higher reading than 150 on 3/4 (orange circle). It’s positive that new lows contracted immediately to 24, the most bullish zone, and closed at 11 (blue circle)
Watching the New lows on the New York Stock exchange is a simple technical tool that helps awareness about the immediate trend's direction. In my book Journey to Wealth, when the new lows are below 25, the market is very strong (Very Low Risk, and prices tend to rise).
Monitor the new lows on the New York Stock Exchange if they start to expand. As long as new lows are between 25 and 50, the odds of a further rally are likely. On the other hand, if new lows begin to expand, it would suggest a higher risk environment.
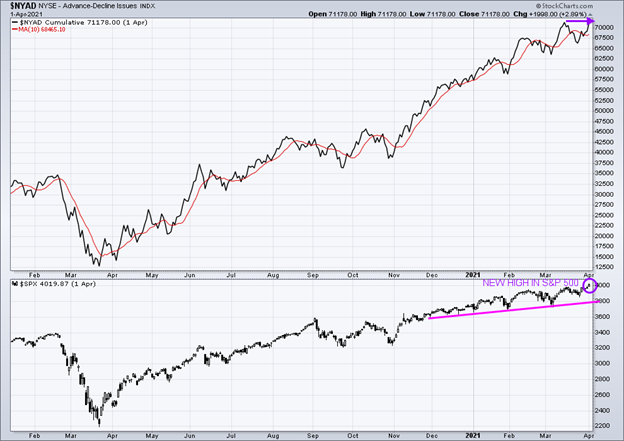
Figure 2: New York Stock Exchange Advance-Decline Line Top and S&P 500 Index Bottom
Source: Stockcharts.com
Market breadth has improved. The advance/decline line (A/D) is one of my favorite technical indicators that measures market breadth. The A/D line shows how many stocks are participating in a stock market rally or decline. It represents a cumulative total of the number of stocks advancing versus the number of stocks declining. When the A/D line rises, it means that more stocks are rising than declining (and vice versa).
In the top portion of the chart, you will notice The NYSE A/D line is very close to making a new high (purple arrow), which would confirm the new high in the S&P 500 Index (lower chart (purple circle). Historically rarely does the market make a final peak when the cumulative advance-decline line makes a new high.
Support for the S&P 500 is 3723.34 (March 4 low). A close below is likely to trip the sell stops and increase selling.
Positives
- Semiconductor (SMH) outperformed QQQ and XLK again. If SMH continues to outperform, it would be bullish for both the broad market and technology sector.
- S&P 500 (SPY) closed at a record high.
- Russell 2000 (IWM) gained 1.46%, closing above key 220 support, and Relative Strength was stronger than the S&P 500.
- Nasdaq and growth stocks that have fallen over 30% turned up even though 10-year rates rose last week.
- April is a seasonally strong month of the year.
- Dow Jones Transportation Average is at a new high, confirming the S&P 500 high (see Figure 2).
Figure 2: Dow Jones US Industrial Transportation Index
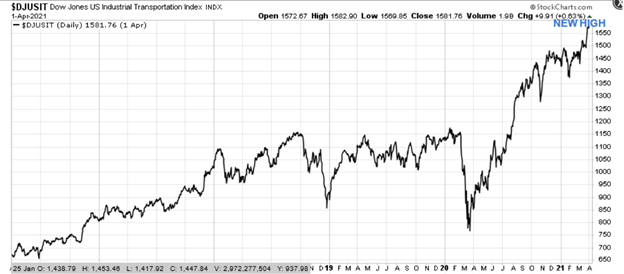
Source: Stockcharts.com
Negatives
- New highs on Nasdaq were only 132, much less than on 2/8 high of 706.
- Intermediate chart patterns on stocks and major averages show weakening momentum patterns and not yet in a safe buy zone.
- Emerging Market (EEM) is below its 50-day moving average.
- With strong gains last week, market sentiment based on CNN Fear and Greed Index closed on 04/1/21 at 58, showing greed, up from 40 when the reading showed fear.
- CBOE Volatility VIX Index (VIX) (a measurement of fear) fell to 17.33, its lowest since Feb 2019.
- The Russell 2000 (IWM) momentum so far is weak, different than early in the year when it was a market leader.
Watch the Russell 2000 Index and Nasdaq 100 this week.
Figure 3: Daily iShares Russell 2000 Price (Top) and 12-26-9 MACD (Bottom)
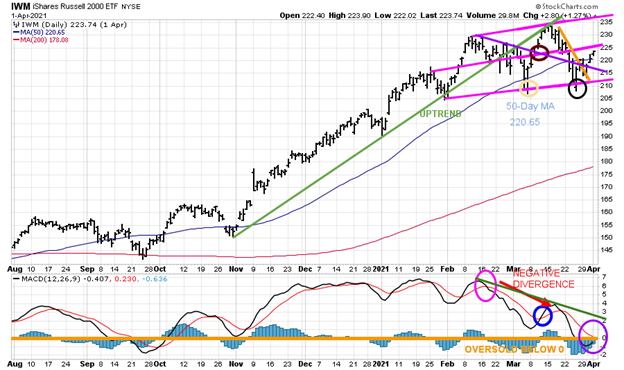
Source: Stockcharts.com
The top portion of the chart is the daily iShares Russell 2000 Index ETF (IWM), the benchmark for small-cap stocks, with a 50-day moving average (blue line) and 200-day moving average (red line) that traders watch and use to define trends.
After slightly penetrating the bottom of the channel and the 50-day MA (yellow circle), on 3/5 at 207.21, IWM rallied to break the daily downtrend (purple line) penetrating resistance at 220.00 (brown circle) stalling at 234.15, the upper channel that coincided with the old uptrend line from November (in green). Then IWM reversed, falling below the 50-day MA (blue line) to the lower channel (black circle), where the buyers stepped in, successfully testing the March 4 low.
IWM closed on 4/1 at 223.74 near resistance at 225.00. A close above 225.00 would imply further gains to test the 3/15 high at 234.53 and potentially further gain to 252.00.
Support is 220.00, followed by 215.00 and 210.00. A close below 207.21 is likely to trip the sell stops and a more severe decline to follow.
The bottom half of the chart is MACD (12, 26, 9), a measure of momentum. MACD remains on its February sell (pink circle). In early March, MACD did not get below 0, an oversold condition (orange line) where a proper reset and buy would occur before turning up (blue circle).
IWM then rallied to 234.53 on 3/15 MACD but did not confirm the high. MACD showed clear signs of weakening momentum turning down, forming a bearish negative divergence (red arrow). (A negative divergence forms when price makes a higher high, and MACD forms a lower high.
MACD is now oversold, below 0 (orange line), and in a position to generate a buy (purple circle) if IWM rises over the next few days. It would be a positive sign the rally could be strong if MACD can break the downtrend (green line). Time will tell.
Figure: 4 Daily Invesco QQQ Trust Nasdaq (QQQ) Price (Top) and 12-26-9 MACD (Bottom)
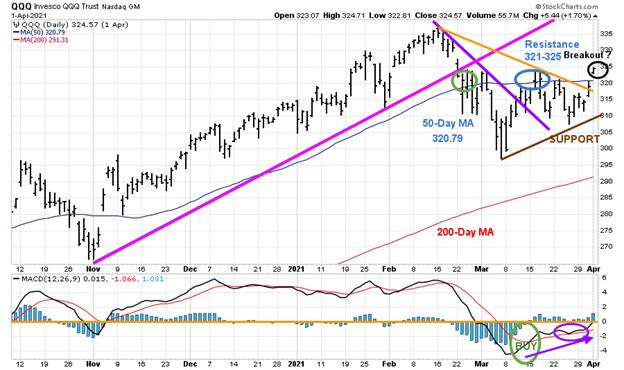
Source: Stockcharts.com
The top part of the chart shows the daily Invesco QQQ (QQQ), an exchange-traded fund based on the Nasdaq 100 Index with its 50-day moving average and 200-day moving average. The daily uptrend of QQQ from November (pink line) was violated in February (green circle), shifting the daily trend down. On 3/12, QQQ broke the downtrend (purple line) but failed to sustain enough momentum to stay above the 50-day MA (blue circle) and turned lower.
QQQ lagged for a few weeks but last week led the way. QQQ appears to have successfully tested the March lows holding above 305.00 support each time on its recent pullbacks. On 3/31, QQQ broke the downtrend from February (orange line), and then on 4/1, QQQ closed above the 50-day MA at 320.79. The combination is bullish.
QQQ closed at 324.55, just under key resistance at 325.00. Watch the largest holdings in QQQ, Apple (APPL), Microsoft (MSFT), and Amazon (AMZN), which represent almost 30% for a clue to the strength of QQQ this week. QQQ looks as if an upside breakout has occurred, and it will break out of last week’s trading range.
On the other hand, if QQQ stalls now and turns down closing below 323.00, more base building may be needed. Short-term support is at 320.00, followed by 315.00 and 305.00.
The bottom half of the chart is MACD (12, 26, 9, a measure of momentum. MACD remains on a buy, turning up from below 0, an oversold condition (green circle). At first, MACD did not show any strength, no thrust to the upside, moving sideways.
Now the pattern bullish. MACD has formed a favorable double bottom formation (purple arrow) and is a safer buy. Also, the volume indicator that I follow also has turned up confirming the MACD buy, implying a short-term rally is likely.
In sum:
If QQQ closes above resistance at 325.00, it's likely to rally toward 334.34, the 2/16 high. A close below 305.00 would imply a more severe decline is likely to develop.
Figure 5 Daily Vaneck Vectors Semiconductor (SMH) Price (Top) and 12-26-9 MACD (Bottom)
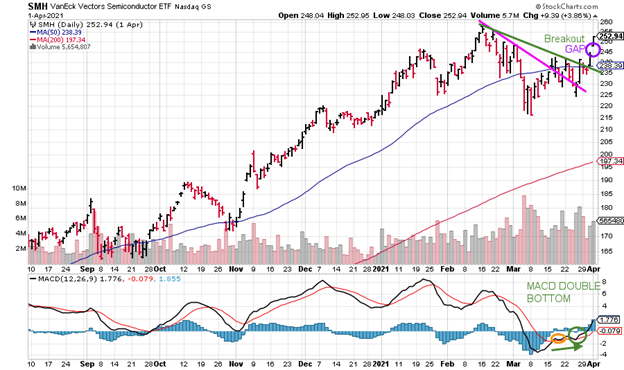
Source: Stockcharts.com
As mentioned in the Market Wealth Update on 03/26/21, SMH broke its downtrend on 3/26 (green line), gaining 5.02% in one day, forming a favorable MACD double bottom buy formation (green arrow). SMH declined for two days before rallying strongly at the end of the quarter and then breaking out, gapping up on 4/1, giving an upside objective to 261.00.
It would be bullish if SMH remains above 248.00 and does not fill the gap (purple circle). A close below 224.00 would negate the bullish objective.
Summing Up:
Last Thursday’s close was very promising for the overall market. Semiconductors and Technology led the advance, closing at its highs and above their 50-day moving average. Russell 2000 and QQQ have successfully tested their March lows. IWM appears ready to generate a new buy on MACD. The NYSE A/D line is close to making a new high, confirming the new high in the S&P 500 Index. If 10-year Treasury yields move lower, this could be the catalyst to fuel the advance for growth stocks. QQQ looks as if a breakout to the upside has occurred, and another leg up has started. Continue to give the benefit of the doubt to the bulls unless there is a close below 207.21 for IWM and below 305.00 for QQQ.
Remember to manage your risk, and your wealth will grow.
Learn more about Bonnie Gortler at BonnieGortler.com
Disclaimer: Although the information is made with a sincere effort for accuracy, it is not guaranteed that the information provided is a statement of fact. Nor can we guarantee the results of following any of the recommendations made herein. Readers are encouraged to meet with their own advisors to consider the suitability of investments for their own particular situations and for determination of their own risk levels. Past performance does not guarantee any future results.


