

A three-week winning streak for the Dow and S&P 500 (SPX) happened as the week closed at their session highs, states Bonnie Gortler of bonniegortler.com.
Ten of the 11 S&P sectors finished higher during the week ending 04/09/21. Technology (XLK) led the broad market higher for the second week in a row, gaining +4.64%. Consumer Discretionary (XLY) up +3.87% continued to gain relative strength over the last few weeks. The weakest sector was Energy (XLE), which fell by -4.21%. SPDR S&P 500 ETF Trust (SPY), in comparison, gained +2.72%.
S&P SPDR SECTOR ETFs SUMMARY
Week of 4/9/21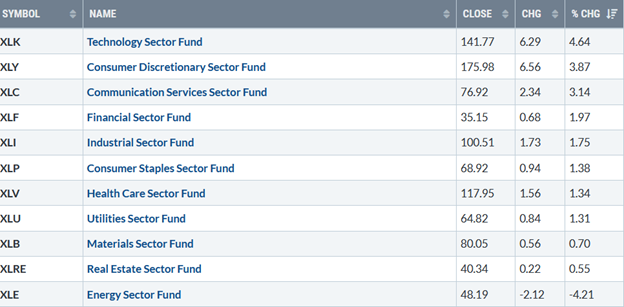
Source: Stockcharts.com
Investors are still watching 10-Year Treasury yields, which fell this week, closing below its 1.75% high in 2021 at 1.66%. A close below 1.60 for two days would be a positive sign that rising rates may pause in the near term, which is likely to fuel the rally higher. On the other hand, if yields rise above 1.75%, it may ignite more selling in the broad market.
The Dow gained +1.95% for the week, the S&P 500 was up +2.71%, and the Nasdaq gained +3.12%, its third weekly gain in the past eight weeks. Last week market internals had no real improvement in market breadth or volume to get excited about.
Weekly market breadth on the New York Stock Exchange Index was positive with 2239 advances and 1176 declines. Nasdaq breadth was slightly positive with 2319 advances and 2000 declines. Daily new lows on Nasdaq were disappointing, inching up to 42 from 24 on 4/1. New highs on the Nasdaq decreased instead of expanding as the week continued, despite the week's Nasdaq accelerating higher. (see Figure 1)
Figure 1: Daily Nasdaq New Highs 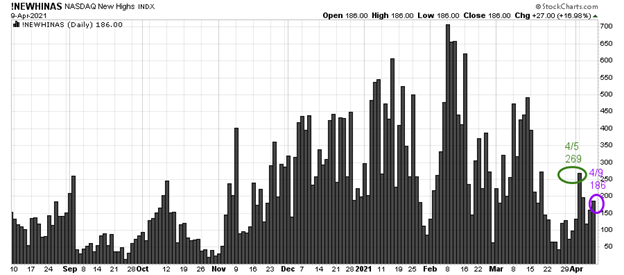
Source: Stockcharts.com
Each day this past week, New lows remained below 25, showing healthy underlying internal strength.
Figure 2: Daily New York Stock Exchange New Lows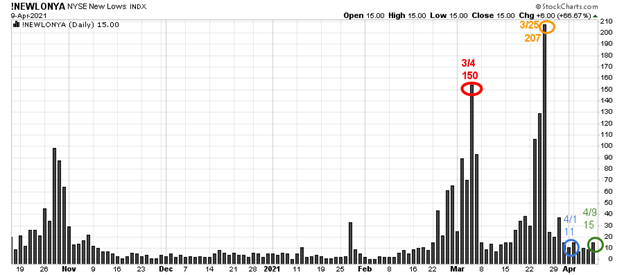
Source: Stockcharts.com
On 3/25, the NYSE new lows were 207 (see Figure: 1), a higher reading than 150 on 3/4 (orange circle), and then new lows immediately contracted to fall to the most bullish zone on 4/1 when they closed at 11 (blue circle). On 4/9, new lows closed at 15, in the most bullish zone (see Figure 2).
Watching the new lows on the New York Stock exchange is a simple technical tool that helps awareness about the immediate trend's direction. In my book Journey to Wealth, when the new lows are below 25, the market is very strong (very low risk and prices tend to rise).
Monitor the new lows on the New York Stock Exchange if they start to expand. As long as they remain between 25 and 50, the odds of a further rally are likely, and risk is low. On the other hand, if new lows begin to expand, it would suggest a higher risk environment and more caution.
Figure 3: New York Stock Exchange Advance-Decline Line Top and S&P 500 Index Bottom 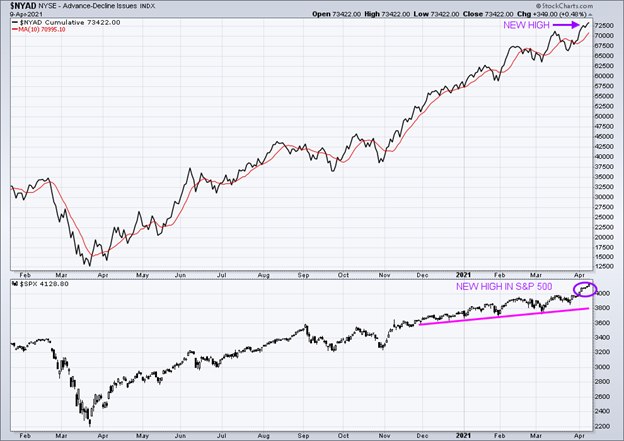
Source: Stockcharts.com
In the top portion of the chart (Figure 3), you will notice The NYSE A/D line made a new high (purple arrow), confirming the new high in the S&P 500 Index (lower chart (purple circle). Historically rarely does the market make a final peak when the cumulative advance-decline line makes a new high.
Market breadth on the New York Stock Exchange is positive. The advance/decline line (A/D) is one of my favorite technical indicators that measures market breadth. The A/D line shows how many stocks are participating in a stock market rally or decline. It represents a cumulative total of the number of stocks advancing versus the number of stocks declining. When the A/D Line rises, it means that more stocks are rising than declining (and vice versa).
The S&P 500 Index closed at 4128.80 (bottom chart). Short-term support is at 4034.44, the low on 4/5 where the S&P 500 appears to have started a new leg higher. Key support for the S&P 500 remains at 3723.34 (March 4 low). A close below the 3/4 low is likely to trip the sell stops and increase selling pressure.
“Financial freedom is available to those who learn about it and work for it” ~Robert Kiyosaki
Figure 4: Performance 4/5 - 4/9
Key ETFs to Monitor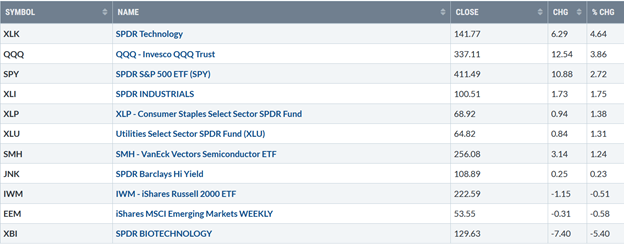
Source: Stockcharts.com
Positives
- April is a seasonally strong month of the year.
- S&P 500 continues to close at record highs.
- Some growth stocks that have fallen over 30% were positive for the week and now have more favorable short-term momentum patterns.
- 10-year rates appear to have stabilized.
- Hi-Yield (JNK) and open-end high yield corporate bond funds had a profitable week and are at or near their February highs.
Negatives
- New highs on Nasdaq are way below their 2/8 high of 706.
- Emerging Markets (EEM), a leader early in the year in relative strength, is lagging the US market, falling 11.6% from its February 16 peak. Although it is off its low, EEM remains below its 50-day moving average.
- Market sentiment (contrary indicator) based on CNN Fear and Greed Index closed on 04/9/21 at 60, showing greed. American Association of Individual Investors (AAII) is at the most bullish reading of the past three years.
- Semiconductor was weaker than XLK and Nasdaq 100 (QQQ). If SMH continues to underperform, it would not be a good sign for the technology sector and could lead to selling in the broad market.
- Russell 2000 (IWM), down for the week 0.58%, lags the S&P 500. IWM closed below resistance at 225.00 and has now generated a new MACD intermediate sell.
- Valuations are high. S&P 500 is trading at nearly 22 times forward earnings.
Watch the Russell 2000 Index, Nasdaq 100, and Semiconductors this week for direction.
Figure 5: Daily iShares Russell 2000 (IWM) Price (Top) and 12-26-9 MACD (Bottom)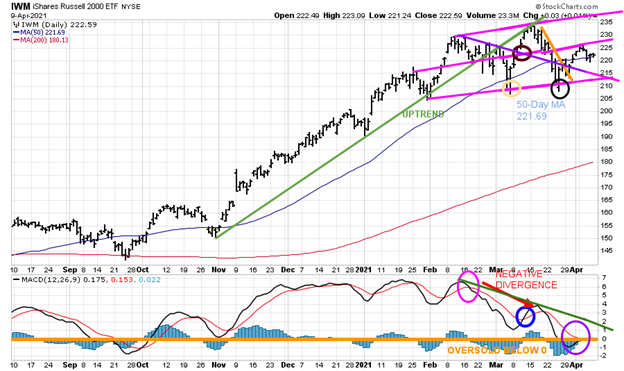
Source: Stockcharts.com
The top portion of the chart is the daily iShares Russell 2000 Index ETF, the benchmark for small-cap stocks, with a 50-day moving average (blue line) and 200-day moving average (red line) that traders watch and use to define trends.
After slightly penetrating the bottom of the channel and the 50-Day MA (yellow circle), on 3/5 at 207.21, IWM rallied to break the daily downtrend (purple line) penetrating resistance at 220.00 (brown circle) stalling at 234.15, the upper channel that coincided with the old uptrend line from November (in green). Then IWM reversed, falling below the 50-day MA (blue line) to the lower channel (black circle), where the buyers stepped in, successfully testing the March 4 low.
IWM closed on 4/9 at 222.59, down -0.55% for the week, unable to get through resistance at 225.00. A close above 225.00 would imply further gains to test the 3/15 high at 234.53 and potentially further gain to 252.00.
Support is 220.00, followed by 215.00 and 210.00. A close below 207.21, the 5/5 low, is likely to trip the sell stops and a more severe decline to follow.
The bottom half of the chart is MACD (12, 26, 9), a measure of momentum. MACD remains on its February sell (pink circle). In early March, MACD did not get below 0, an oversold condition (orange line) where a proper reset and buy would occur before turning up (blue circle).
IWM then rallied to 234.53 on 3/15 MACD but did not confirm the high. MACD showed clear signs of weakening momentum turning down, forming a bearish negative divergence (red arrow). (A negative divergence forms when price makes a higher high, and MACD forms a lower high.
MACD remains in a downtrend, oversold, and below 0 (orange line). It’s disturbing IWM is showing no signs of strength. However, MACD could generate a buy (purple circle) if IWM rises over the next few days.
Figure: 6 Daily Invesco QQQ Trust Nasdaq (QQQ) Price (Top) and 12-26-9 MACD Bottom)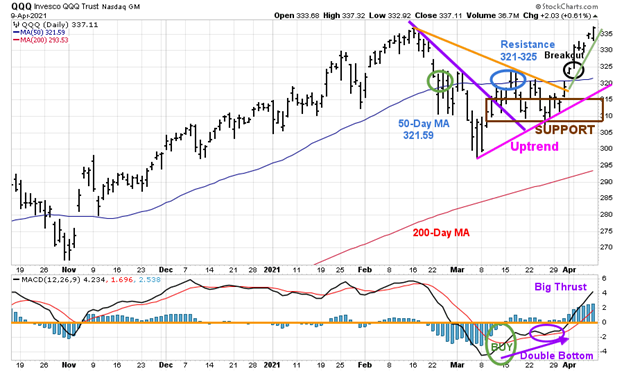
Source: Stockcharts.com
The top part of the chart shows the daily Invesco QQQ, an exchange-traded fund based on the Nasdaq 100 Index with its 50-day moving average and 200-day moving average. On 3/12, QQQ broke the downtrend (purple line) but failed to sustain enough momentum to stay above the 50-day MA (blue circle) and turned lower.
QQQ lagged for a few weeks successfully tested the March lows holding above 305.00 support each time on its recent pullbacks. On 3/31, QQQ broke the downtrend from February (orange line) and broke out to the upside.
The largest holdings in QQQ, Apple (APPL), Microsoft (MSFT), and Amazon (AMZN), which represent almost 30%, rose sharply last week, fueling QQQ to break out of its trading range and get through resistance at 325.00. QQQ closed at 337.11, just under its 2/16 high of 338.19. The thrust is bullish. If QQQ holds above 330.00, the short-term uptrend (light green line) implies a rise to 343.00 and possibly 358.00.
If QQQ stalls, the first support is at 330.00, and then between 320.00 and 325.00. However, the key support is between 308.00 and 315.00. A close below 315.00 would break the uptrend and increase the risk of a pullback to 308.00.
A close below 308.00 would imply a test of the 3/5 low at 297.00 and the start of a more significant correction.
The bottom half of the chart is MACD (12, 26, 9, a measure of momentum. MACD remains on a buy, turning up from below 0, an oversold condition (green circle). At first, MACD did not show any strength, no thrust to the upside, moving sideways.
However, last week the MACD pattern turned bullish, when MACD formed a favorable double bottom formation. (purple arrow) implying a short-term rally is likely. QQQ had a great week, up almost 4%.
Figure 7: Daily Vaneck Vectors Semiconductor (SMH) Price (Top) and 12-26-9 MACD (Bottom)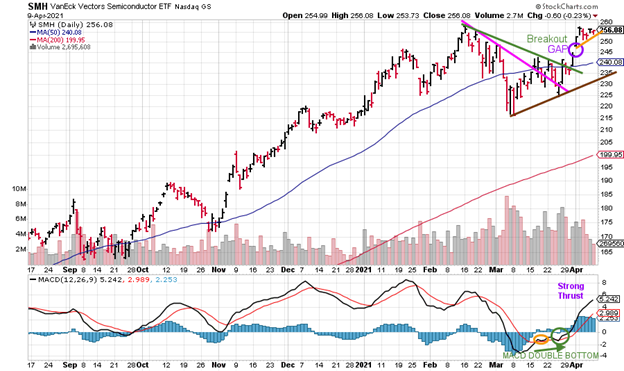
Source: Stockcharts.com
SMH broke its downtrend on 3/26 (green line). At the same time, MACD formed a favorable MACD double bottom buy formation (green arrow). SMH held above 248.00, not filling the gap (purple circle), consolidating this week up 1.24%. It’s bullish the gap has not been filled. The upside objective is 261.00.
A close below 248.00 would negate the bullish objective.
Summing Up:
The Dow and S&P 500 made new record highs last week while the Russell 2000 was down for the week showing no signs of strength. QQQ broke out to the upside, and it appears another leg up has started. SMH held above its gap, giving up no ground and a strong thrust in momentum. The NYSE A/D line confirmed the new high in the S&P 500 Index, implying the final top has most likely not been seen. The tape continues to be positive and not worth fighting against. The trend is your friend, and it remains up until proven otherwise. Continue to give the benefit of the doubt to the bulls unless there is a close below 207.21 for IWM and below 308.00 for QQQ.
Remember to manage your risk, and your wealth will grow.
Learn more about Bonnie Gortler at BonnieGortler.com
Disclaimer: Although the information is made with a sincere effort for accuracy, it is not guaranteed that the information provided is a statement of fact. Nor can we guarantee the results of following any of the recommendations made herein. Readers are encouraged to meet with their own advisors to consider the suitability of investments for their own particular situations and for determination of their own risk levels. Past performance does not guarantee any future results.


