

Fueled by strong economic data and favorable earnings reports, the Dow and S&P 500 made new record highs for the week, states Bonnie Gortler of bonniegortler.com.
The Nasdaq had its third straight week of gains. Ten of the 11 S&P sectors finished higher during the week ending 04/016/21. Utilities (XLU) and Materials (XLB) were the strong sectors gaining +3.69% and +3.26%, respectively. The weakest sector was Communication Services (XLC), which fell by 0.10%%. SPDR S&P 500 ETF Trust (SPY), in comparison, gained +1.40%.
S&P SPDR SECTOR ETFs SUMMARY
Week of 4/16/21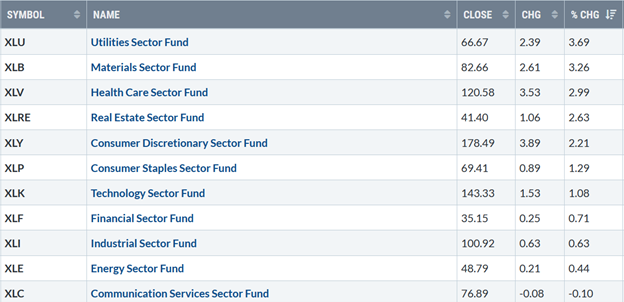
Source: Stockcharts.com
10-Year Treasury yields fell this week, below the key 1.6% breaking the uptrend from January (red line in Figure 1), closing at 1.57%. It’s a positive sign that rates have stopped rising and appear to have stabilized for now. If this trend continues, it's likely to fuel the broad market higher. On the other hand, if rates rise and close above 1.7%, it could raise concerns again and be the catalyst for the broad market to decline.
Figure 1:10-Year Treasury Yields
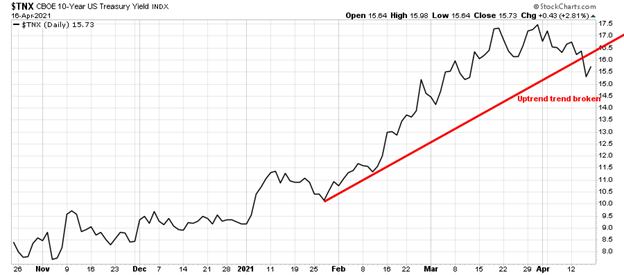
Source: Stockcharts.com
The Dow gained +1.18% for the week, the S&P 500 was up +1.37%, and the Nasdaq gained +1.0%, its third straight positive. Weekly market breadth was mixed. The New York Stock Exchange Index was positive, with 2049 advances and 1362 declines. Nasdaq breadth was negative with 1894 advances and 2439 declines.
It's concerning that despite the Nasdaq gains for the week, daily new highs showed only a slight increase from 186 (purple circle) on 4/9 to 200 on 4/16 (red circle), nowhere near their highs set earlier in the year and so far, 269 on 4/5 (see Figure 2). Watch if this trend continues higher if new highs begins to broaden.
Figure 2: Daily Nasdaq New Highs
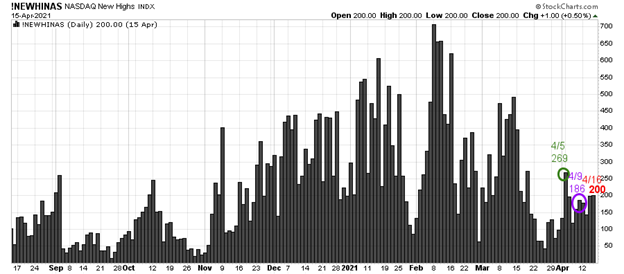
Source: Stockcharts.com
Figure 3: Daily New York Stock Exchange New Lows
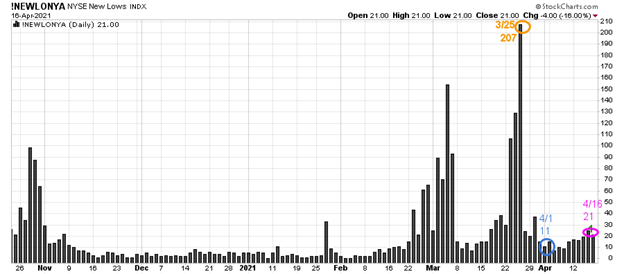
Source: Stockcharts.com
On 3/25, the NYSE new lows peaked at 207 (orange circle) and then immediately contracted to 11 on 4/1 (blue circle). New lows have remained in the bullish zone below 25 for the past three weeks closing at 21on 4/16, showing healthy underlying internal strength (pink circle).
Continue to monitor the new lows on the New York Stock Exchange if they start to expand. As long as they remain between 25 and 50, the odds of a further rally are likely, and risk is low. On the other hand, if new lows begin to expand, it suggests a higher risk environment and more caution.
Figure 4: New York Stock Exchange Advance-Decline Line Top and S&P 500 Index Bottom
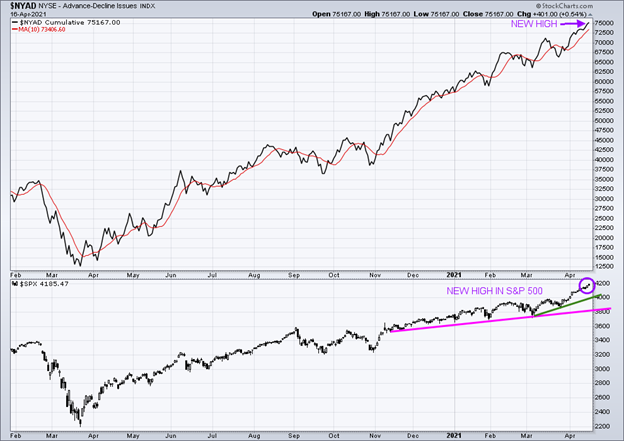
Source: Stockcharts.com
In the top portion of the chart (Figure: 4), you will notice The NYSE A/D line once again made a new high (purple arrow), confirming the new high in the S&P 500 Index (lower chart (purple circle). Historically rarely does the market make a final peak when the cumulative advance-decline line makes a new high.
Market breadth on the New York Stock Exchange remains positive. The advance/decline line (A/D) is one of my favorite technical indicators that measures market breadth. The A/D line shows how many stocks are participating in a stock market rally or decline. It represents a cumulative total of the number of stocks advancing versus the number of stocks declining. When the A/D Line rises, it means that more stocks are rising than declining (and vice versa).
The S&P 500 closed at 4185.47, keeping the uptrend intact (Figure 4: bottom chart). A close below initial support at 4000.00 would break the uptrend and be a warning of potential weakness. A close below 3723.34, the 3/4 low, would likely trip the sell stops and increase selling pressure beginning a more sustained decline.
Risk comes from not knowing what you are doing. – Warren Buffett
Figure 5: Performance 4/12 - 4/16
Key ETFs to Monitor
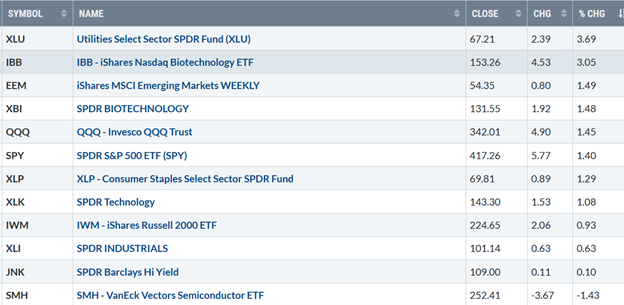
Source: Stockcharts.com
Positives
- April is a seasonally strong month of the year.
- NYSE had 453 new highs, its best reading since 03/8/21 when there was 461.
- Biotechnology, a high-risk sector, was one of the leading sectors for the week. XBI broke its downtrend during the week and is above key support. (see Figure: 10)
- 10-year rates appear to have stabilized, closing below 1.60%
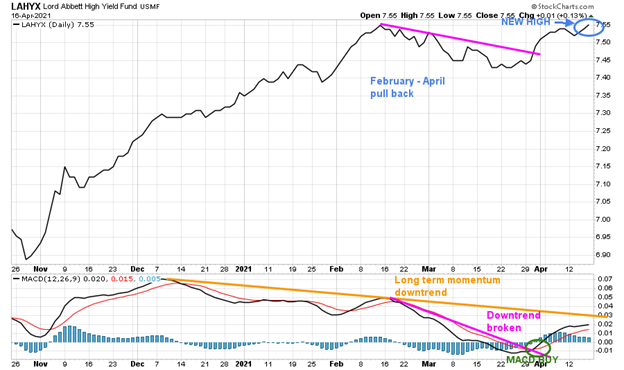
- Hi-Yield (JNK) is stable, no longer falling and near its highs. Open-end high yield corporate bond funds, which were falling in February, had a profitable week and are at or near their February highs. For example, Lord Abbett High Yield, one of my favorite high-yield mutual funds.
Figure 6: Lord Abbett High Yield
Negatives
- New nighs on Nasdaq remain sluggish and are way below their 2/8 high of 706.
- Emerging Markets (EEM), a leader early in the year in relative strength early in the year, remains below its 50-Day Moving Average.
- Market sentiment (contrary indicators) CNN Fear and Greed Index closed on 04/16/21 at 59, showing greed. American Association of Individual Investors (AAII) week ending 4/14/21 closed at 53.8%, down from 56.9%, which was one of the most bullish readings of the past three years.
- Semiconductor (SMH) was down for the week and continues to be weaker than XLK and QQQ. If SMH continues to underperform, it would be bearish for the technology sector, leading to weakness in the broad market.
- Russell 2000 (IWM) lags the S&P 500 (SPY) in relative strength and remains below 225.00, key resistance.
- Valuations remain high. S&P 500 is trading at nearly 22 times forward earnings.
What ETFs to watch this week for direction?
Figure 7: Daily iShares Russell 2000 (IWM) Price (Top) and 12-26-9 MACD (Bottom)
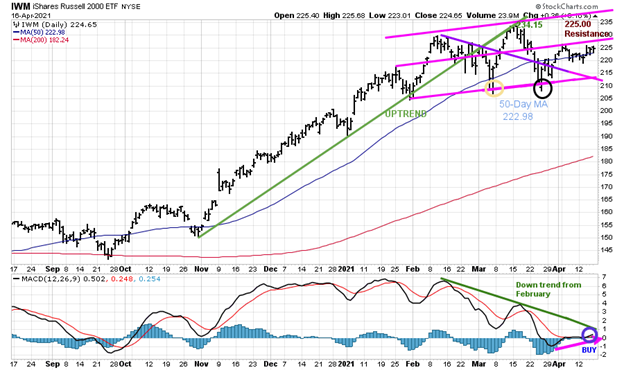
Source: Stockcharts.com
The top portion of the chart is the daily iShares Russell 2000 Index ETF (IWM), the benchmark for small-cap stocks, with a 50-day moving average (blue line) and 200-day moving average (red line) that traders watch and use to define trends.
After slightly penetrating the bottom of the channel and the 50-day MA (yellow circle), on 3/5 at 207.21 stalled at 234.15, the upper channel that coincided with the old uptrend line from November (in green). Then IWM fell below the 50-day MA to the lower channel (black circle), where the buyers stepped in, successfully testing the March 4 low.
IWM rose + 0.93% for the week closing at 224.65, just under resistance at 225.00. With MACD generating a fresh buy, a close above 225.00 would imply further gains to test the 3/15 high at 234.53 and potentially further gain to 252.00.
Support is 222.00, followed by 215.00. A close below 215.00 would be a short-term negative. A close below 207.21, the 3/5 low, is likely to trip the sell stops and be a clue more weakness will occur.
The bottom half of the chart is MACD (12, 26, 9), a measure of momentum. MACD has generated a new buy (blue circle) turning up from below 0. However, MACD remains in a downtrend (green line). It would be positive if MACD would break the downtrend over the next few days and start to accelerate higher, showing more upside momentum.
Figure 8: Daily Invesco QQQ Trust Nasdaq (QQQ) Price (Top) and 12-26-9 MACD Bottom)
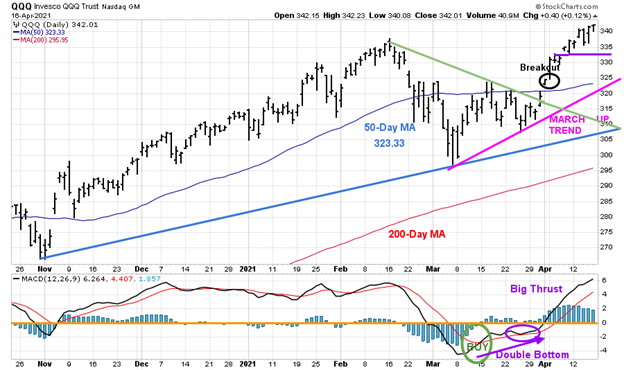
Source: Stockcharts.com
The top part of the chart shows the daily Invesco QQQ (QQQ), an exchange-traded fund based on the Nasdaq 100 Index with its 50-day moving average and 200-day moving average.
On 3/31, QQQ broke the downtrend from February (green line) and then gapped higher (black circle), breaking out to the upside. The largest holdings in QQQ, Apple (AAPL), Microsoft (MSFT), and Amazon (AMZN), which represent almost 30%, fueled QQQ to get through resistance at 325.00 and then on 4/16 breaking the 2/16 high of 338.19. QQQ closing at 342.01 just under our projection to 343.00 mentioned on the Market Wealth Update Week Ending 040921. The next upside objective is 358.00.
First support is at 331.00, and then 320.00. The 50-day MA is at 323.30, where many traders place their stops. A close below 320.00 would break the March uptrend (pink line) and increase the odds of short-term weakness.
A close below 305.00 would imply the start of a more significant correction as I would not expect the March low of 297.00 to hold.
The bottom half of the chart is MACD (12, 26, 9, a measure of momentum. MACD remains on a buy, turning up from below 0, an oversold condition (green circle). At first, MACD did not show any strength, no thrust to the upside, moving sideways. However, in the last two weeks, QQQ has risen sharply and has been one of the strongest sectors. As long as 10 Year Treasury yields remain stable, I would expect this trend to continue.
Figure 9: Daily Vaneck Vectors Semiconductor (SMH) Price (Top) and 12-26-9 MACD (Bottom)
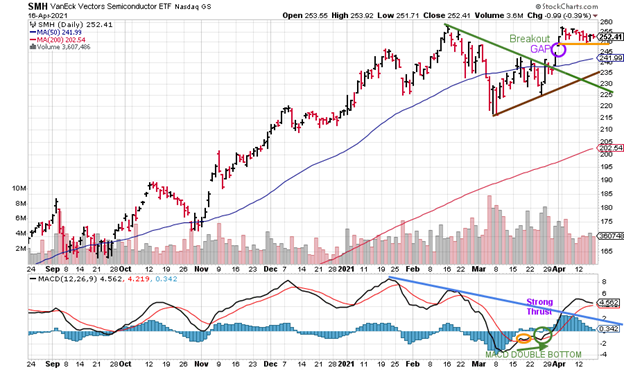
Source: Stockcharts.com
The top chart shows SMH broke its downtrend on 3/26 (green line). SMH last week lost -1.43% but held above 248.00, not filling the gap (purple circle), forming a consolidation pattern. It’s bullish the gap has not been filled. The upside objective is 261.00.
MACD remains on a buy after rising from a favorable double bottom formation (green arrow) in the lower chart. A strong thrust and the downtrend broken from January implies further gains are likely.
Short-term support is 248.00, followed by 242.00. A close below 248.00 would negate the upside objective. A close below 230.00 would imply a more serious decline will occur.
Speculative Buy Biotechnology (IBB)
Figure: 10 Daily Ishares Nasdaq Biotechnology (IBB) Price (Top) and 12-26-9 MACD Bottom)
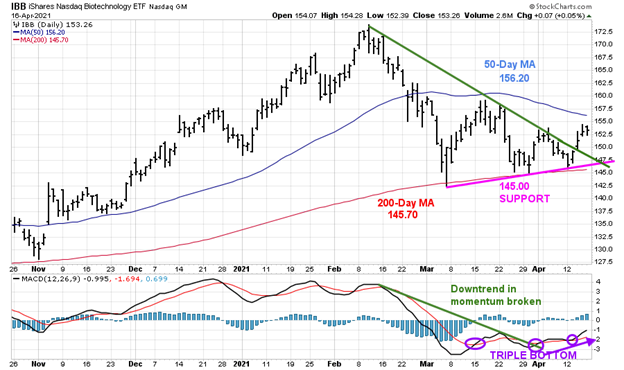
Biotechnology (IBB) appears to have successfully tested its 3/5 low after slightly penetrating its 200-day MA. IBB held support on 4/12 at 145.00, testing the April lows, and then turned up breaking the downtrend from February on 4/14, closing at 153.26. The upside objective is 167.00. A close above the 50 Day MA 156.20 is likely to trip buy stops.
MACD (lower portion) has broken the downtrend from February (green line) and has formed a triple bottom formation, one of the most bullish technical patterns.
As close below 145.00 would negate the upside projection.
Summing Up:
Strong economic data powered the major averages to continue their winning ways last week, with the Dow and S&P 500 making new record highs last week and the Nasdaq within 1% of its all-time peak. The Nasdaq had its third straight week of gains and is getting close to its record high. QQQ is one point from its first upside objective at 343.00 and appears ready to resume its climb to its next objective at 358.00. Semiconductors (SMH) held above their gap after its strong upside thrust in momentum, and after completing its consolidation pattern, SMH could resume leading the market averages higher. The Russell 2000 (IWM) and Biotechnology (IBB) look ready to join the advance. Continue to give the benefit of the doubt to the bulls unless there is a close below 207.21 for IWM and below 305.00 for QQQ.
Remember to manage your risk, and your wealth will grow.
Learn more about Bonnie Gortler at BonnieGortler.com
Disclaimer: Although the information is made with a sincere effort for accuracy, it is not guaranteed that the information provided is a statement of fact. Nor can we guarantee the results of following any of the recommendations made herein. Readers are encouraged to meet with their own advisors to consider the suitability of investments for their own particular situations and for determination of their own risk levels. Past performance does not guarantee any future results.


