

After news about increasing the capital gains tax rate on wealthy individuals, stocks declined last week but rebounded, states Bonnie Gortler of bonniegortler.com.
Four of the 11 S&P sectors finished higher. Real Estate (XLRE) and Healthcare (XLV) were the best sectors, gaining +2.03% and +1.81%, respectively. The weakest sector was Energy (XLE), down -1.78%. The SPDR S&P 500 ETF Trust (SPY), in comparison, was down -0.12%.
S&P SPDR SECTOR ETFs SUMMARY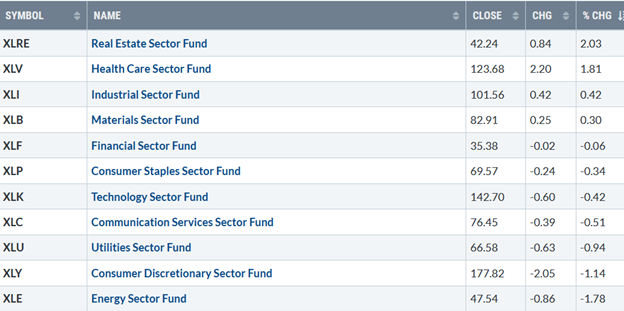
Source: Stockcharts.com
10-Year Treasury yields fell, after breaking the uptrend from January the previous week (red line in Figure 1), closing at 1.567%, remaining below 1.6%, a key area. It’s a positive sign that rates have stopped rising sharply and appear to have stabilized for now. If this trend continues, it's likely to fuel the broad market higher.
Watch rates this week. On the other hand, if rates break the downtrend (purple line) and close above 1.6% and continue to rise, closing above 1.7% would raise concerns that rates will rise again and could be the catalyst for a market correction.
Figure 1:10-Year Treasury Yields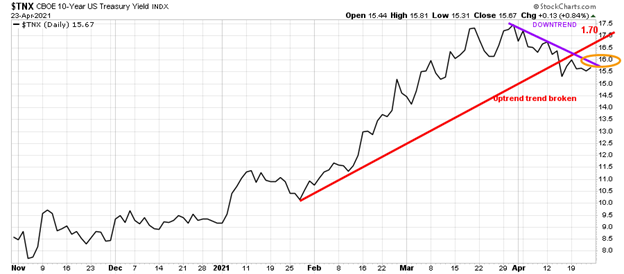
Source: Stockcharts.com
The Dow was down -0.46% for the week, the S&P 500 was down -0.13%, and the Nasdaq lost 0.25.%. The Dow ended its four-week winning streak. The Nasdaq broke its three-week winning streak but had its best daily gain since 4/5. The Russell 2000 (IWM) bucked the trend up +0.49%, its second straight weekly gain and the best-performing major average last week.
Weekly market breadth had more winners than losers on both the New York and Nasdaq Index despite the small losses for the week. The New York Stock Exchange Index had 1767 advances and 1641 declines. Nasdaq had 2267 advances and 2101 declines.
It remains concerning with the Nasdaq near record highs that daily new highs closed on 4/24 at 173 (red circle) and are nowhere near their highs of 708 set on 2/8/21(purple circle) or above 4/5 when they reached 269 (green circle). (see Figure 2). Watch if this trend continues higher if new highs begins to broaden or if they continue to lag. If new highs do lag, the rally will start to fade over the next week or two.
Figure 2: Daily Nasdaq New Highs 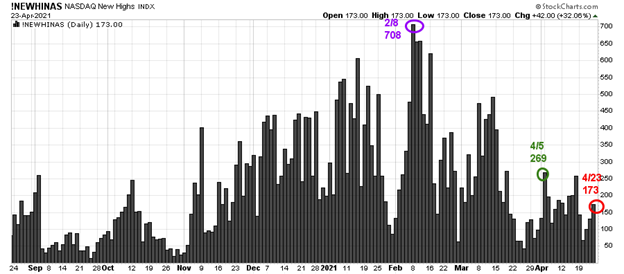
Source: Stockcharts.com
Watching the new lows on the New York Stock exchange is a simple technical tool that helps awareness about the immediate trend's direction. In my book, Journey to Wealth, when the new lows are below 25, the market is very strong (very low risk and prices tend to rise).
Figure 3: Daily New York Stock Exchange New Lows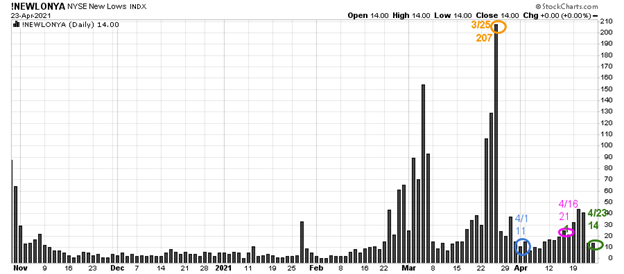
Source: Stockcharts.com
On 3/25, the NYSE new lows peaked at 207 (orange circle) and then immediately contracted to 11 on 4/1 (blue). New lows have remained in the bullish zone below 25 for the past four weeks. On 4/23, new lows closed at 14 (green), even lower than on 4/16 (pink), continuing to show healthy underlying internal strength.
Continue to monitor the new lows on the New York Stock Exchange if they start to expand. As long as they remain between 25 and 50, the odds of a further rally are likely, and risk is low. On the other hand, if new lows begin to expand, it would suggest a higher risk environment and more caution.
Figure 4: New York Stock Exchange Advance-Decline Line Top and S&P 500 Index Bottom 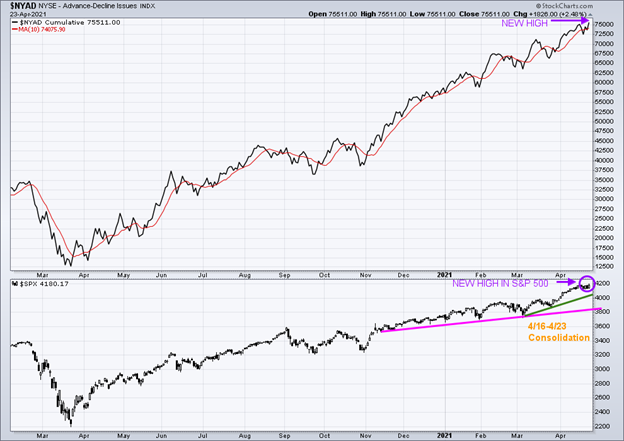
Source: Stockcharts.com
In the top portion of the chart (Figure: 4), you will notice The NYSE A/D line once again made a new high (top chart purple arrow). The S&P 500 consolidated this week, making an intraday record high on 4/23 but closed just below its high made on 4/16/21 (lower chart purple circle). Historically rarely does the market make a final peak when the cumulative advance-decline line makes a new high.
Market breadth on the New York Stock Exchange remains positive. The advance/decline line (A/D) is one of my favorite technical indicators that measures market breadth. The A/D line shows how many stocks are participating in a stock market rally or decline. It represents a cumulative total of the number of stocks advancing versus the number of stocks declining. When the A/D Line rises, it means that more stocks are rising than declining (and vice versa).
The S&P 500 (SPX) closed at 4180.17, keeping the shorter-term uptrend intact. A close below initial support at 4000.00 would break the uptrend (green line) and warn of potential weakness. A close below 3723.34, the 3/4 low, and the longer-term trend line (pink) would likely trip the sell stops and increase selling pressure beginning a more sustained decline.
Risk comes from not knowing what you are doing. – Warren Buffett
Figure 5: Performance 4/19 - 4/23
Key ETFs to Monitor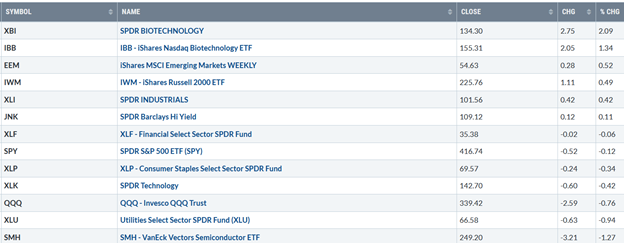
Source: Stockcharts.com
Positives
- Biotechnology (IBB), a high-risk sector, was the leading sector for the week, now in an uptrend, closing above key support (see Figure 10).
- Russell 2000 (IWM) was stronger than the S&P 500 ETF (SPY) last week, holding above support on the decline and, rallied to close above the first area of resistance at 225.00.
- Emerging Markets (EEM), a leader early in the year in relative strength early in the year, outperformed the S&P 500 and closed above its 50-day moving average, closing at its highest level since 3/11/21.
- Hi-Yield (JNK) closed near its highs. Open-end high yield corporate bond funds remain at or near their highs.
- Defensive sectors lagged as investors were willing to take on risk and rotated into more aggressive sectors.
- Many growth stocks, which have been under heavy selling pressure the last few weeks seem to have stabilized and have started to rise.
- The Dow Transports continue to make new highs.
Negatives
- Market sentiment (contrary indicators) CNN Fear and Greed Index rose from 04/16/21 at 59 to close at 62, showing greed. American Association of Individual Investors (AAII) week ending 4/21/21 closed at 52.7%, slightly lower than 56.9% on 4/7, which was one of the most bullish readings of the past three years.
- Semiconductor (SMH) was down for the week and continues to be weaker than XLK and QQQ. If SMH continues to underperform, it would be bearish for the technology sector, ultimately leading to weakness in the broad market.
- Valuations remain high. S&P 500 is trading at 22.3 times forward earnings estimate as of 4/12/21 (Source ycharts.com).
- The Nasdaq Advance-Decline Line has continuously made lower highs in 2021, not confirming highs in Nasdaq (Figure 6). Watch closely now.
Figure 6: The Nasdaq Advance-Decline Line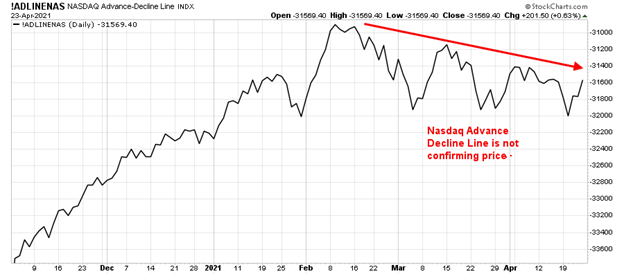
Source: Stockcharts.com
What ETFs to Observe This Week for Direction?
Figure 7: Daily iShares Russell 2000 (IWM) Price (Top) and 12-26-9 MACD (Bottom)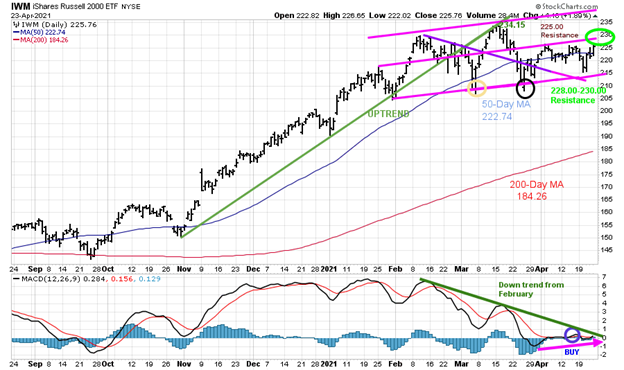
Source: Stockcharts.com
The top portion of the chart is the daily iShares Russell 2000 Index ETF, the benchmark for small-cap stocks, with a 50-day moving average (blue line) and 200-day moving average (red line) that traders watch and use to define trends.
After slightly penetrating the bottom of the channel and the 50-day MA (yellow circle), on 3/5 at 207.21 stalled at 234.15, the upper channel that coincided with the old uptrend line from November (in dark green). Then IWM fell below the 50-day MA to the lower channel (black circle), where the buyers stepped in, successfully testing the March 4 low.
IWM closed at 225.76 above its resistance at 225.00, implying further gains towards the 3/15 high at 234.53 and potentially 252.00. It’s positive IWM closed above the 50-day moving average. Resistance is between 228 and 230.00 green circle). A close above 230.00 would likely get the bulls excited.
On the other hand, if there is no follow-through to the upside, support is at 222.00, followed by 215.00. A close below 215.00 would be a short-term negative. A close below 207.21, the 3/5 low, is likely to trip the sell stops and be a clue more weakness will occur. With recent strength the past two weeks and the successful test of the March lows, I am expecting higher prices in the near term.
The bottom half of the chart is MACD (12, 26, 9), a measure of momentum. MACD remains on a (blue circle) turning up from below 0, not quite breaking the downtrend (green line). It would be positive if MACD would break the downtrend and start to accelerate higher, showing more upside momentum.
Figure 8: Daily Invesco QQQ Trust Nasdaq (QQQ) Price (Top) and 12-26-9 MACD Bottom)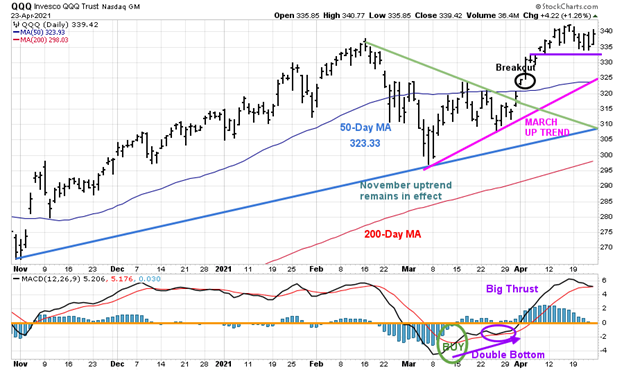
Source: Stockcharts.com
The top part of the chart shows the daily Invesco QQQ, an exchange-traded fund based on the Nasdaq 100 Index with its 50-day moving average and 200-day moving average.
On 3/31, QQQ broke the downtrend from February (green line) and then gapped higher (black circle), breaking out to the upside. QQQ closed at 339.42. The upside objective is 358.00. A close below 324.00 would negate the upside objective.
The 50-day MA is at 323.93, where many traders place their stops. First support is at 331.00, followed by 324.00 and then 320.00. A close below 320.00 would break the March uptrend (pink line) and increase the odds of short-term weakness.
A close below 305.00 would break the November uptrend (blue line) and imply the start of a more significant correction.
The bottom half of the chart is MACD (12, 26, 9, a measure of momentum. MACD remains on its early March buy (green circle) but has turned down since its big thrust to the upside. Its positive MACD confirmed the high in QQQ, and the trend is up. The first sell that occurs is likely not to be as significant as the second MACD sell over the next few weeks.
Figure 9: Daily Vaneck Vectors Semiconductor (SMH) Price (Top) and 12-26-9 MACD (Bottom) 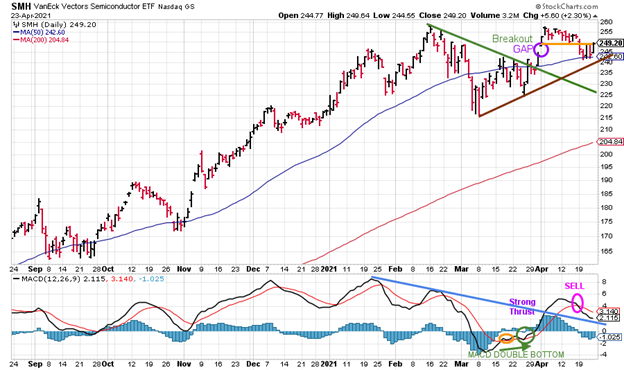
Source: Stockcharts.com
The top chart shows SMH broke its downtrend on 3/26 (green line). SMH then gapped up (purple circle), breaking out to a high of 256.68on 4/8, but stalled.
SMH was down last week -1.27%. SMH filled the gap on 4/19 and broke under the consolidation pattern. Short-term support at 248.00 did not hold during the week, negating the bullish pattern and canceling the upside objective of 261.00.
On the other hand, it was a positive sign that Friday’s recovery rally SMH was the best sector gaining 2.3%, leading the broad market higher. Its bullish SMH held the uptrend from the 3/3 low (brown line), and it closed above its 50 Day MA.
Short-term support is 242.00, followed by 225.00. Resistance is 255.00. A close below 242.00 would be negative. A close above 255.00 would imply more gains ahead.
The lower chart is MACD, a measure of momentum. After rising from a favorable double bottom formation (green arrow), MACD generated a sell quickly. MACD remains above the downtrend (blue line) after the strong thrust in momentum. If MACD turns up now, that would be a positive sign, but note MACD is not yet below 0 for a safe entry.
Update on Speculative Buy Biotechnology (IBB) from 4/16 Wealth Update
Figure10: Daily Ishares Nasdaq Biotechnology (IBB) Price (Top) and 12-26-9 MACD Bottom)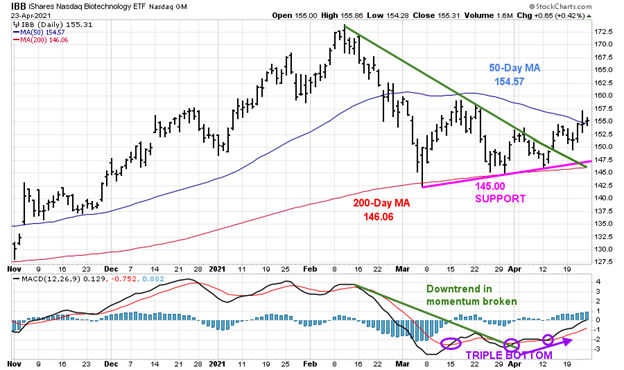
Source: Stockcharts.com
Biotechnology successfully tested its March and April low breaking the downtrend from February on 4/14/21.
Biotechnology was the leading sector for the week, up +1.34%, closing at 155.31. IBB's short-term trend is now up. It’s a positive sign IBB closed above its 50 Day MA for the first time since late February.
The upside objective is 167.00. Support is at 152.00 followed by 149.00. A close below 145.00 would negate the upside projection.
MACD (bottom chart) is on a buy and has broken the downtrend from February (green line). MACD has formed a triple bottom formation, one of the most bullish technical patterns. Continue to hold for now.
Figure 11: Speculative Buy iShares Emerging Markets (EEM) 04/26/21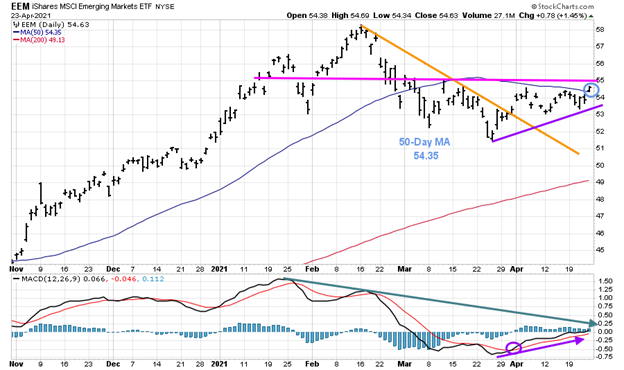
The top part of the chart is Emerging Markets (EEM), an exchange-traded fund with its 50-week moving average and 200-week moving average. EEM has exposure to large and mid-cap emerging market equities. The top three countries are Hong Kong (32.94%), Taiwan 13.47%, and Korea 12.86% as of 4/19/21.
EEM appears to have successfully tested its 3/25 low. Emerging Markets (EEM) has been in a trading range since early April. EEM was up 0.52% last week, closing at 54.63, above its 50-day moving average for the first time since February.
A close above 55.00 would give an upside objective to 59.00, followed by 65.00. A close below 52.50 would negate the upside projection.
MACD is on a buy. With further gains in EEM, look for MACD to gain momentum and break its downtrend from February (green line), which would be bullish for the near term.
Summing Up:
The result through the up and down volatility of last week was nothing more than market indices consolidating in a narrow range near their highs. The Russell 2000 (IWM) and Biotechnology (IBB) more speculative areas rose last week as the major averages consolidated, finishing slightly lower. The tape action remains mostly favorable on light volume as traders wait for more news about economic data, taxes, and more corporate earnings results released this week. If Biotechnology, Small Caps, and Emerging Markets show strength, this would be the underlying catalyst to the major averages breaking out of their consolidations to the upside. Continue to benefit the doubt to the bulls unless there is a close below 207.21 for IWM and below 305.00 for QQQ.
Remember to manage your risk, and your wealth will grow.
Learn more about Bonnie Gortler at BonnieGortler.com
Disclaimer: Although the information is made with a sincere effort for accuracy, it is not guaranteed that the information provided is a statement of fact. Nor can we guarantee the results of following any of the recommendations made herein. Readers are encouraged to meet with their own advisors to consider the suitability of investments for their own particular situations and for determination of their own risk levels. Past performance does not guarantee any future results.


