

If you read all the talented people who write for this website, you’ll find each has a unique view on how to succeed at trading, explains Jeff Greenblatt of Lucas Wave International.
Truly, there are lots of methodologies, which give you an edge to enable you to put on winning trades. My Kairos methodologies are one way but there are others. Whichever methodology gives you an edge, you still need to be technically sound and not make obvious mistakes. It’s easy to lose money at trading and most who have survived will tell you they’ve figured out every possible way to lose money through personal experience.
One way to avoid the mistakes that so many intermediate level traders make is to take inventory of the entire pattern you plan on trading. This is called situational analysis and I’ll take you through one such situation that could have a profound impact on the entire market.
Briefly, a word about the Fed meeting where we learned while the economic and employment situation is improving, the future largely depends on the virus and the vaccine. All I need to do is look at the viral pictures from India to understand with variants out there, the real situation will not give us sustained improvement as far as Covid is concerned.
Let’s be clear, people who go back to work because the lockdowns are eased is not job creation. Even Powell stated the employment picture in bar/restaurant/leisure service sectors is still three million short of the pre-lockdown period. Prior to the lockdowns in 2020 the stock market already proved to us it could not absorb even modest rate hikes. The economy was weak before any of this started. Do you really expect it to even get close to pre-Covid levels after all that has transpired?
The other day I got a call from a friend concerning Citigroup Inc. (C), and he was looking to buy the dip. So, I took a look at the entire pattern. I’m going to take you through the decision-making process to determine if a trade is worthwhile. We pick up the discussion after it put in the recent high during this pullback phase. There are two questions. If you want to be long, where to do it? The other question is whether you should try to buy this dip at all. My understanding is that a stock-picking service called for a buy three days after the high. Would that have been a good decision?
The first thing I did was put the Gann calendar readings on the chart because that’s the most precise way to understand the pattern on a daily stock chart. The challenge is so few traders know the Gann calendar even exists. This article is not about the Gann calendar in particular, so you’ll need to break down your chart with the methodology that works for you. Whatever you do, you’ll need to be thorough.
What the Gann calendar does is assign a vibration to each trading day of the year based on the 360dg orbit of the earth for the entire year. The orbit is not purely circular so there were certain adjustments that need to be made to get the calendar exactly right. I started looking at this pattern from the low in November, which fell on a 218dg vibrational day. The high came in at 294dg and the corresponding pullback hit at 312dg.
The bottom line is the high on January 14 was a 294dg day. The low, which followed was February 1, which was 312dg. When we connect the dots, we find the low to low (the two lows) had a difference of 94dg, which lines up with the 294dg high. This is vibrational methodology, it’s not algebra (which is linear math) and it’s not numerology. The market works on a combination of price and time relationships or vibrations. So, we had a buy signal based on the Gann calendar at the 94 vibration. The only problem I had with that setup was it dropped below the gap up. Rarely do we get perfect conditions. That’s where discernment and experience win the day. In this case the vibration was so good it jumped off the page.
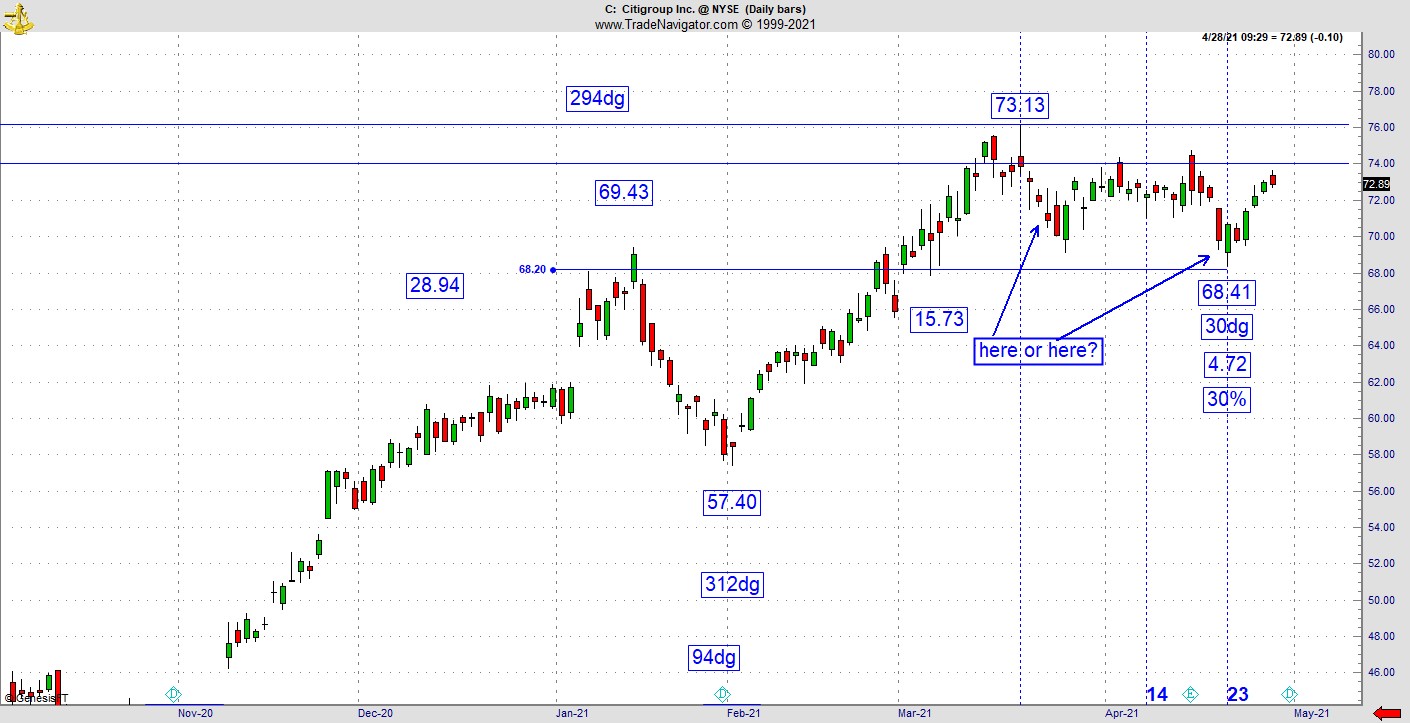
Fast forward to the first arrow several days after the high. Would you buy there? Some people did. Here’s the problem. If you would’ve bought for the first time three days after the high you would’ve been buying after a good move, which is never a wise thing to do. Before you consider buying any pullback you need to understand what created the high in the first place.
Now look at the second chart, which connects the horizontal resistance zone back to the bear market last year. Do you see how this pattern rallied all the way up to the gap down last year? That’s major resistance and not a coincidence. For many developing traders, this is easy to miss but absolutely is driving the pattern.
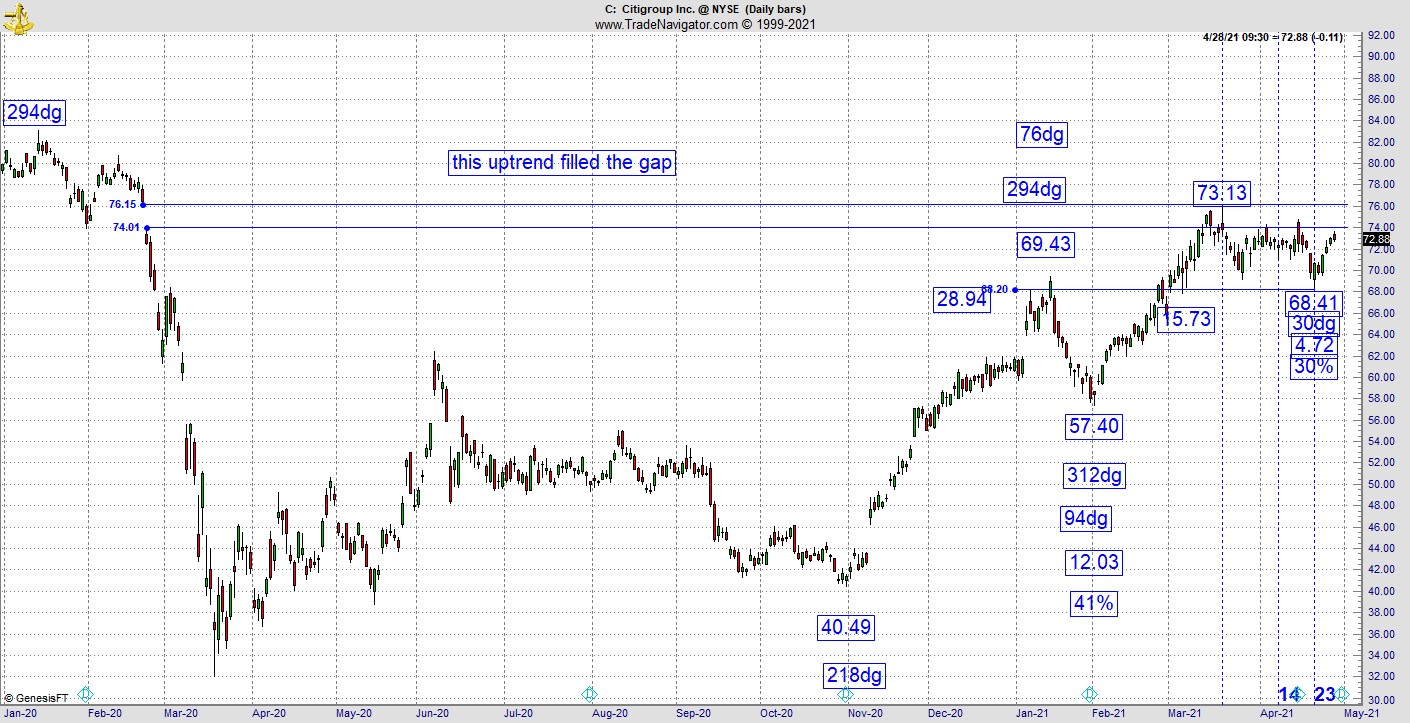
So now that you know why it found the high, would you still have bought three days after now that you know you would’ve been buying into major resistance? See how that one bit of new information completely changes the landscape? The Kairos vibrations (in my case) are always important but just as important is the need to make an adjustment in your thinking as the pattern ages.
That is the importance of doing situational analysis. Momentum traders will tell you to keep buying every dip until the strategy doesn’t work anymore. That’s true to a point and as you gain more experience you’ll learn where the hot stove is and be sure not to burn your fingers.
So, does that mean you shouldn’t buy a dip for this stock? Absolutely not, but you have to develop the discipline and patience to see if it will line up again? First of all, we are dealing with a prior high and there was a good chance that polarity point would be tested, which it was. Here’s what happened.
Polarity did flip and there was a buy signal (at least using the Gann calendar), which materialized on April 21. April 21 turned out to be the 30dg day on the calendar, which by itself doesn’t mean much until we realize this pullback is also a 30% retracement back to the 57.40 low. It also had a good candle formation. So, it’s a buy. But what kind of a buy signal is it?
You can obviously buy a polarity flip that vibrates properly so what is the problem? The problem is we are already a year into a good rally. Good trading discipline suggests one wants to get in early in the move because those who get in late have little staying power in case of adversity. In other words, if you are a C trader and participated in the move back in November or even February, you got the meat of the move, not the crumbs. If this dip was bought last week that’s all you might end up with.
I told my friend it was buyable after April 21 but with one caveat. It is awfully close to and going to retest that gap, which stalled the rally in the first place. Yeah, it might blow through it but more likely to consolidate once it gets to the zone. As you can see, the closer it gets to the zone, the smaller the candles get. Even if it breaks through, there is every chance it will come back to test polarity just like all patterns do. So, if you don’t mind a swing trade, which might not turn into a sustained leg up, you can take do it, but you must know what you are getting into. Want to see how a pattern will react to resistance. Let’s look at the KBW Nasdaq Bank Index (BKX).
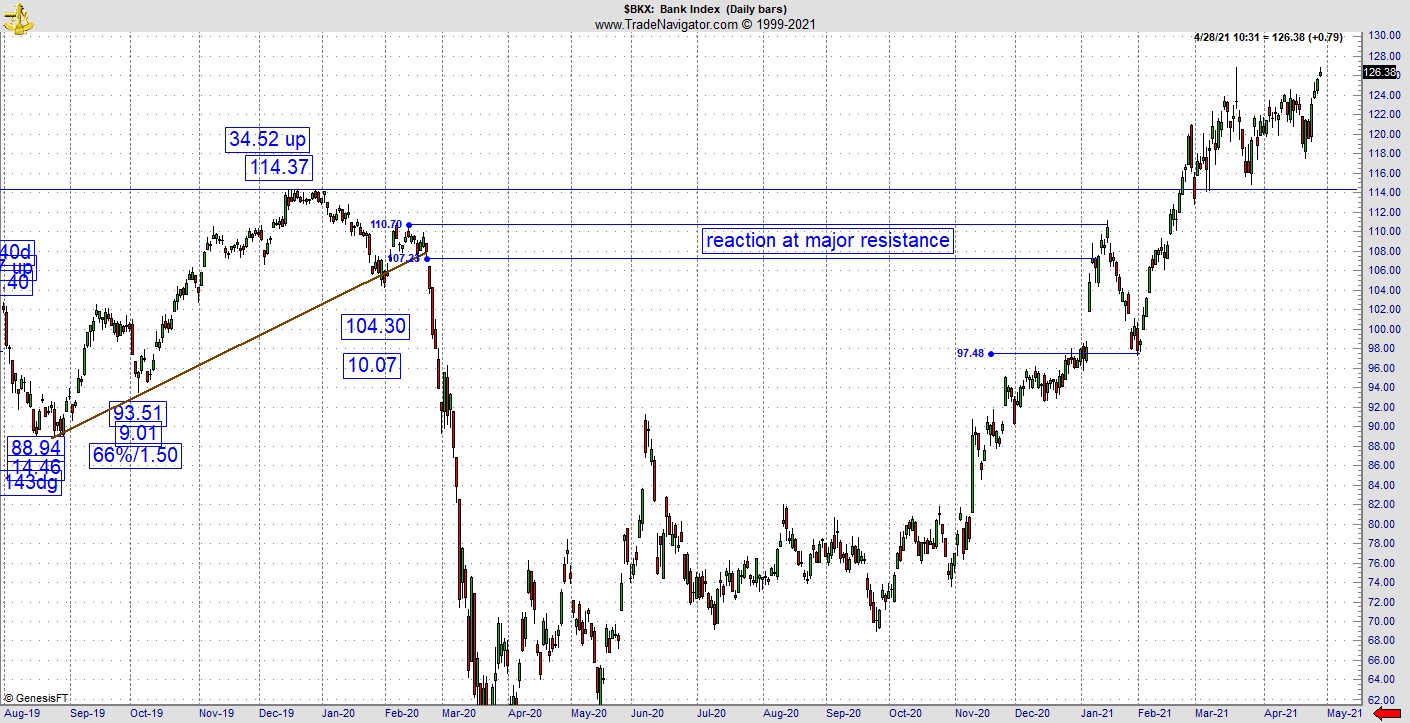
The BKX came to similar resistance and sold off to the point it filled the prior gap on the way up. It made a new high but pulled back right to retest the prior top. Now its struggling to go higher. At this point, what C does at resistance in the next few could be the “tell”, which reveals the market. If C rolls over it could take the BKX with it and if that happens there will be a consequence to the market. If it keeps going, that is meaningful as well. But the higher probability now for C is the path forward should be rocky and the easy money has been made.
So, should you have bought this dip? That’s for you to decide, but at least you’ll know exactly what you are getting into.
For more information about Jeff Greenblatt, visit Lucaswaveinternational.com.


