

The Dow and S&P 500 made new record highs despite disappointing economic data. Seven of the 11 S&P sectors finished higher last week, states Bonnie Gortler of bonniegortler.com.
Energy (XLE), Materials (XLB), and Financials (XLF) led the advance to gain +8.58%, +5.82%, and +4.19%, respectively. Real Estate (XLRE) were the weakest sectors, down -0.94%, and Utilities (XLU) -1.02%. The SPDR S&P 500 ETF Trust (SPY), in comparison, was up +1.16%.
S&P SPDR Sector ETFs Performance Summary
Week ending 5/07/21 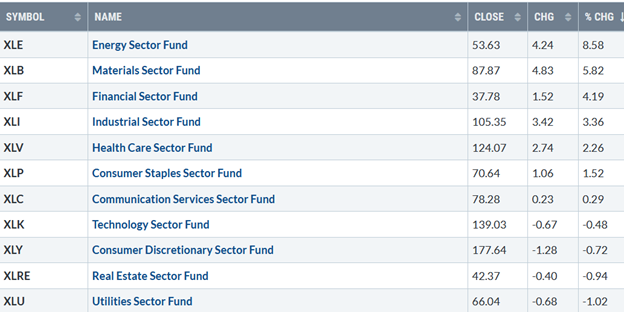
Source: Stockcharts.com
After releasing a disappointing jobs report on 5/7 before the opening,10-year yields immediately fell to 1.47%, the lowest level since 3/11 but rising intraday closing at 1.57%, lower on the week. Value outperformed growth stocks again. The Dow gained +2.70%, its third up week in a row, and the S&P 500 gained +1.23%, both making record highs. The Nasdaq fell -1.5%, its third straight weekly loss despite lower 10-year yields and favorable earnings reports of big tech companies. The Russell 2000 index eked out a small gain, up +0.23%. The DJ Transportation average was the star performer, up 3.89%, continuing to make new highs.
Weekly market breadth was mixed. The New York Stock Exchange Index had 2286 advances and 1171 declines, while Nasdaq breadth was negative with 1928 advances and 2505 declines.
Despite the loss in the Nasdaq, it was positive that daily new highs increased (orange line), breaking the downtrend, closing at 281 (blue circle), surpassing the 269 new highs on 4/5 (green circle), yet well below the peak reading of 708 set on 2/8. Watch the next several weeks if new highs begins to increase or decline to determine if Nasdaq will weaken or get stronger.
Figure 1: Daily Nasdaq New Highs 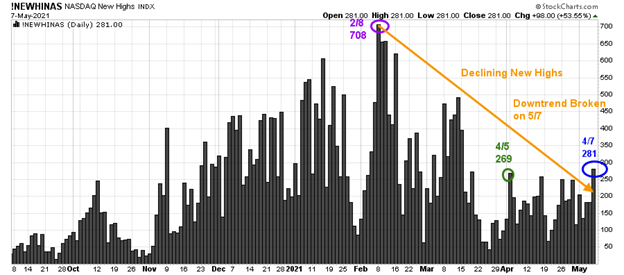
Source: Stockcharts.com
Watching new lows on the New York Stock exchange is a simple technical tool that helps awareness about the immediate trend's direction. In my book Journey to Wealth, when the new lows are below 25, the market is very strong (very low risk, and prices tend to rise).
Figure 2: Daily New York Stock Exchange New Lows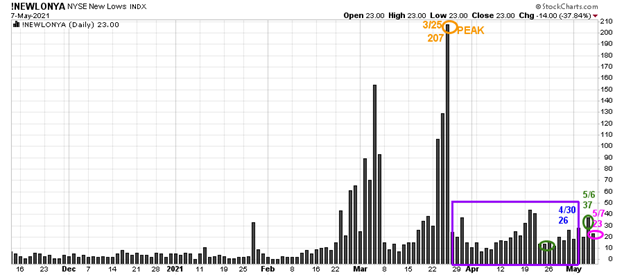
Source: Stockcharts.com
On 3/25, the NYSE new lows peaked at 207 (orange circle) and then immediately contracted (purple rectangle). On 4/30, new lows closed at 26, their highest reading since March, slightly above the most bullish zone.
After rising to 37 on 5/6, new lows contracted 5/7 to 23, the most favorable zone, showing healthy underlying internal strength and likely low-risk environment moving forward.
Continue to monitor the new lows on the New York Stock Exchange if they start to expand. As long as they remain between 25 and 50, risk is low, and the odds of a further rally are likely. On the other hand, if new lows begin to expand, it would suggest a higher risk environment, and more caution is needed.
“What seems too high and risky to the majority generally goes higher and what seems low and cheap generally goes lower.” ~ William O’Neil
Figure 3: New York Stock Exchange Advance-Decline Line Top and S&P 500 Index Bottom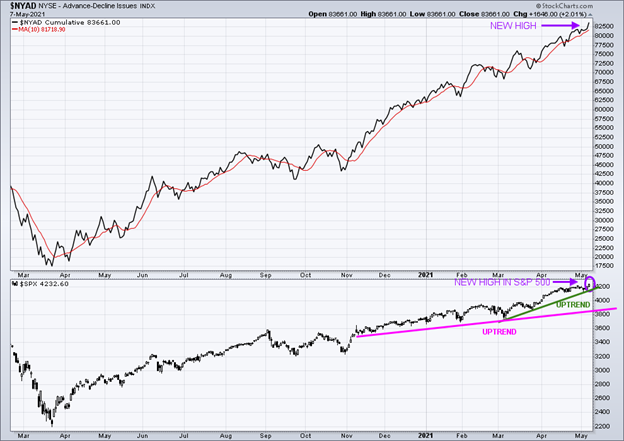
Source: Stockcharts.com
In the top portion of the chart (Figure: 3), you will notice The NYSE A/D line made a new high (purple arrow), confirming the new high in the S&P 500 Index (lower chart (purple circle). Historically rarely does the market make a final peak when the cumulative advance-decline line makes a new high.
The advance/decline line (A/D) is one of my favorite technical indicators that measures market breadth. The A/D line shows how many stocks are participating in a stock market rally or decline. It represents a cumulative total of the number of stocks advancing versus the number of stocks declining. When the A/D Line rises, it means that more stocks are rising than declining (and vice versa).
The S&P 500 closed at 4232.60, keeping the March uptrend intact (Figure 3: bottom chart). A close below the first support at 4100.00 would break the uptrend and warn of additional weakness. A close below 3723.34, the 3/4 low, would likely trip the sell stops and increase selling pressure beginning a more sustained decline.
Key ETFs to Monitor
Figure 4: Performance week of 4/30 - 5/07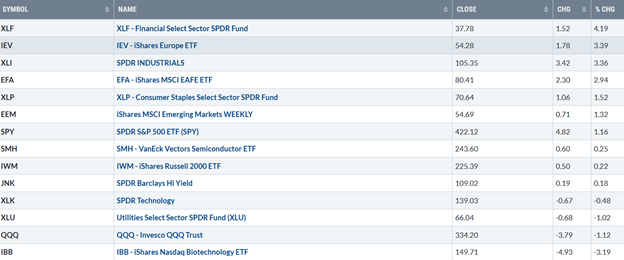
Source: Stockcharts.com
Positives
- The NYSE A/D line made another new high (Figure 3). Historically rarely does the market make a final peak when the cumulative advance-decline line makes a new high.
- Global markets are gaining relative strength vs. the S&P 500 both in the short and intermediate term. Europe (IEV) closed at its highest daily RSI ratio (IEV/SPY) (Figure 6) since March.
- The Dow Jones Transportation Average continues making new highs, confirming the Dow high.
- Hi-Yield (JNK) and open-end high yield corporate bond funds rose last week and are at or near their highs. Lord Abbett High Yield, one of my favorite high-yield mutual funds (Figure 5), is in an uptrend from March and closed at a new high.
Figure 5: Lord Abbett High Yield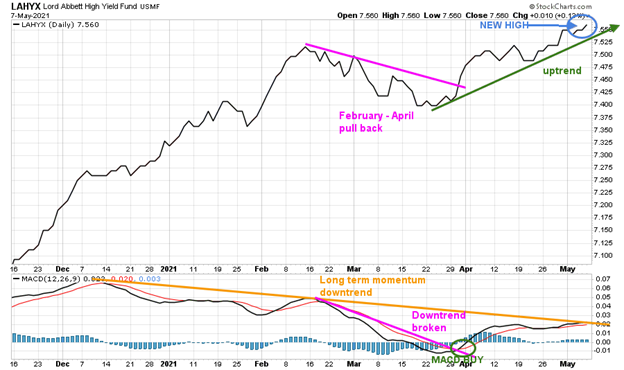
Source: Stockcharts.com
Figure 6: iShares Europe/S&P 500 (IEV/SPY) Relative Strength Ratio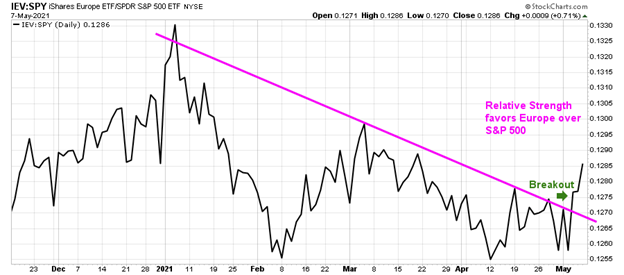
Negatives
- Semiconductor (SMH) and technology stocks (QQQ) are weak. Many growth stocks chart patterns have lower highs and lower lows not yet favorable.
- The Nasdaq Advance-Decline Line has not confirmed highs in Nasdaq and remains in a downtrend (Figure 7).
- Russell 2000 (IWM) continues to underperform the S&P 500 and, so far, is unable to close over resistance above.
- The short-term hourly momentum oscillators of the major averages are not in an oversold position as they were last week to support a rally.
Figure 7: The Nasdaq Advance-Decline Line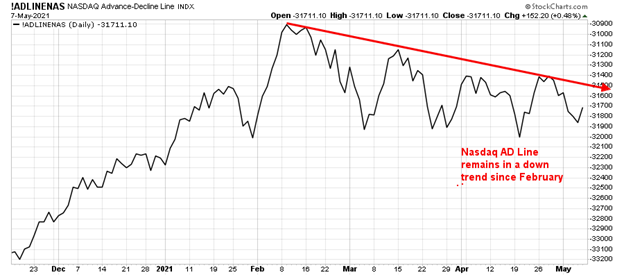
Source: Stockcharts.com
What ETFs to watch this week?
Figure 8: Daily iShares Russell 2000 (IWM) Price (Top) and 12-26-9 MACD (Bottom)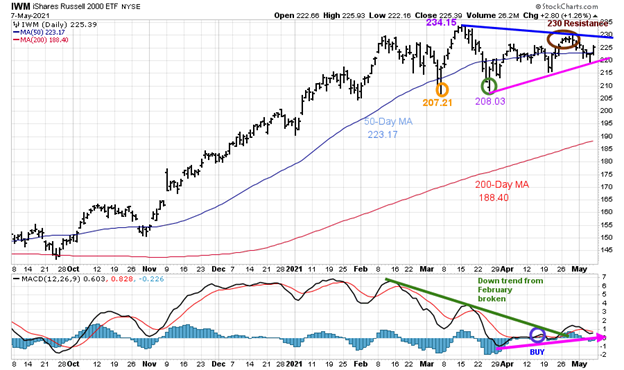
Source: Stockcharts.com
The top portion of the chart is the daily iShares Russell 2000 Index ETF (IWM), the benchmark for small-cap stocks, with a 50-day moving average (blue line) and 200-day moving average (red line) that traders watch and use to define trends. IWM made a low on 3/5 at 207.21, then rallied to 234.15 and turned down successfully tested its low on 3/25 at 208.03 (green circle).
IWM closed at 225.39 above its 50-day moving average, which stands at 223.17, which is a plus. However, IWM remains in a trading range consolidation pattern that has lacked upside momentum to sustain a meaningful rally.
It would be positive if IWM can close above resistance is at 230.00 for two days and break its short-term downtrend from the March highs. The potential upside objective is 252.00. On the other hand, a close below support at 215.00 would be short-term negative and imply another retest of the March low at 207.21.
The bottom half of the chart is MACD (12, 26, 9), a measure of momentum. MACD remains on a buy (blue circle), turning up from below 0. MACD broke the downtrend from February (green line), implying downside momentum is complete, and IWM is likely to go higher. However, so far, there is no upside thrust to get excited about, and more time is needed.
Figure 9: Daily Invesco QQQ Trust Nasdaq (QQQ) Price (Top) and 12-26-9 MACD Bottom)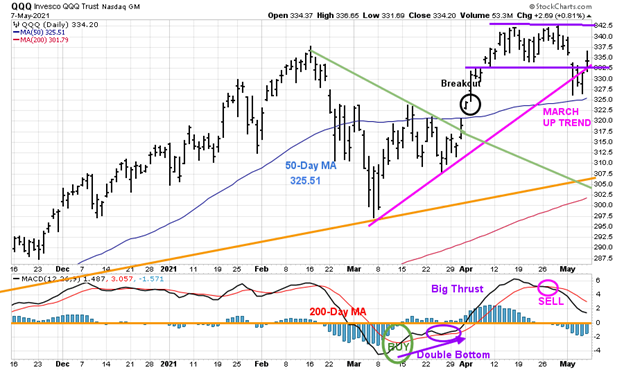
Source: Stockcharts.com
The top part of the chart shows the daily Invesco QQQ, an exchange-traded fund based on the Nasdaq 100 Index with its 50-day moving average and 200-day moving average.
On 3/31, QQQ broke the downtrend from February (green line) and then gapped higher (black circle), breaking out to the upside, staying within a trading range for three weeks.
On 5/4, QQQ fell below the first support at 331.00, breaking its March uptrend (pink line). Buyers stepped in to support QQQ above its 50-day MA to close at 334.20. Even with closing above the 50-day MA, QQQ is not yet showing enough strength to rule out more short-term weakness.
Resistance is at 342.00. The upside objective remains at 358.00. A close below the 50-day MA (325.51) would negate the upside objective. A close below 305.00 would break the November uptrend (orange line) and imply the start of a more significant correction.
The bottom half of the chart is MACD (12, 26, 9, a measure of momentum. After the MACD March buy (green circle) and big thrust to the upside, MACD gave a quick sell. MACD and is not yet oversold, and below 0. More time for an ideal entry is needed. Other sectors remain more attractive at this time.
Figure 10: Daily Vaneck Vectors Semiconductor (SMH) Price (Top) and 12-26-9 MACD (Bottom)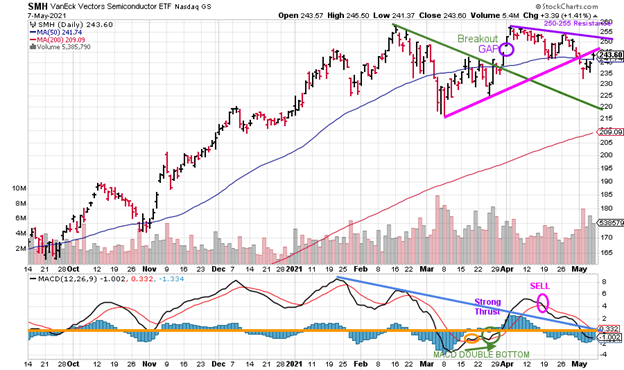
Source: Stockcharts.com
The top chart shows Semiconductors (SMH) broke its March downtrend on 3/26 (green line). SMH then gapped up (purple circle), breaking out to a high of 256.68 on 4/8. SMH reversed lower and filled the gap on 4/19. It concerned me then that SMH could not sustain any upside momentum, which turned out to be right.
Semiconductors (SMH) eked out a gain of +0.25% for the week, closing at 243.60. SMH broke its uptrend from March (pink line). It’s positive that SMH closed above short-term support at 242.00 and above its 50- Day MA. However, similar to QQQ, SMH is not showing any real signs of upside momentum.
Support is 225.00 followed by 220.00. Resistance is between 250.00 and 255.00.
A close above 255.00 would be a short-term positive. A close below 5/3/21 low would be a short-term negative and imply a pullback to 220.00.
The lower chart is MACD, a measure of momentum. After rising from a favorable double bottom formation (green arrow), MACD generated a sell signal quickly. MACD is now below the downtrend (blue line) after the strong thrust in momentum and is now below 0.
Update on Speculative Buy Biotechnology (IBB)
Figure 11: Daily Ishares Nasdaq Biotechnology (IBB) Price (Top) and 12-26-9 MACD Bottom)
Source: Stockcharts.com
Biotechnology (IBB) successfully tested its March and April low breaking the downtrend from February on 4/14/21. Biotechnology (IBB)* broke its short-term uptrend intraday on 5/6 but closed above 145.00 that would have negated the upside projection of 167.00. IBB closed at 149.71 on 5/7.
Resistance is at 152.00, followed by158.00 and 162.00. With the 50-day MA falling along with MACD (bottom chart) showing no upside momentum and now on a sell, if you are still long, I recommend placing a stop at 148.00 to close your position.
*Effective on or around June 21, 2021, the iShares Nasdaq Biotechnology ETF (Nasdaq: IBB) will seek to track the ICE Biotechnology Index. The fund will also undergo changes to its name and investment objective. No action is necessary for investors in the impacted ETFs, and no capital gains distributions are currently expected as a result of the transition. Source: Business Wire
Update on Speculative Buy iShares Emerging Markets (EEM) from 04/30/21
Figure 12: iShares Emerging Markets (EEM) Price (Top) and 12-26-9 MACD Bottom) 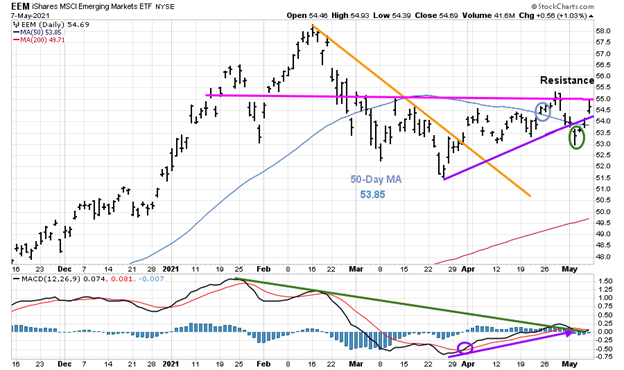
Source: Stockcharts.com
The top part of the chart is Emerging Markets (EEM), an exchange-traded fund with its 50-week moving average and 200-week moving average. EEM has exposure to large and mid-cap emerging market equities. The top three countries are Hong Kong (32.05%), Taiwan 13.80%, and Korea 13.30% as of 5/07/21. Source: https://www.etf.com/EEM#overview
Emerging Markets (EEM) broke its uptrend from March (purple line). After a false breakdown but holding above 52.50, EEM immediately turned. EEM remains in its trading range since early April. EEM finished the week higher by +1.32%, closing at 54.69, above its 50-day moving average.
A close above 55.00 would give an upside objective to 59.00, followed by 65.00. A close below 52.50 would negate the upside projection.
With MACD on a buy and the downtrend from February (green line) broken and EEM above 52.50 continue to hold.
Summing Up:
The Dow and S&P 500 continue to make record highs. Growth continues to lag value by a wide margin. At present, Semiconductors and Technology remain out of favor as momentum indicators are not showing favorable patterns for a shift to occur in the near term. Small caps continue in a trading range and are not showing any real strength yet. The global markets are acting better and could be the next buying opportunity. Europe (IEV) is gaining relative strength vs. the S&P 500 both in the short and intermediate-term, closing at its highest daily RSI ratio (IEV/SPY) since March, which bodes well for the US market to work its way higher. The bulls remain in control unless there is a close below 207.21 for IWM and below 305.00 for QQQ, implying the longer-term trend is in jeopardy.
Remember to manage your risk, and your wealth will grow.
I would love to hear from you. If you have any questions or comments or would like to chat about the market, email me at bonnie@bonniegortler.com.
Learn more about Bonnie Gortler at BonnieGortler.com
Disclaimer: Although the information is made with a sincere effort for accuracy, it is not guaranteed that the information provided is a statement of fact. Nor can we guarantee the results of following any of the recommendations made herein. Readers are encouraged to meet with their own advisors to consider the suitability of investments for their own particular situations and for determination of their own risk levels. Past performance does not guarantee any future results.


