

So, it’s a week later and Bitcoin is still hanging on. By way of review, the recent high and low has been some of the best classic Kairos charts I can show you, explains Jeff Greenblatt of Lucas Wave International.
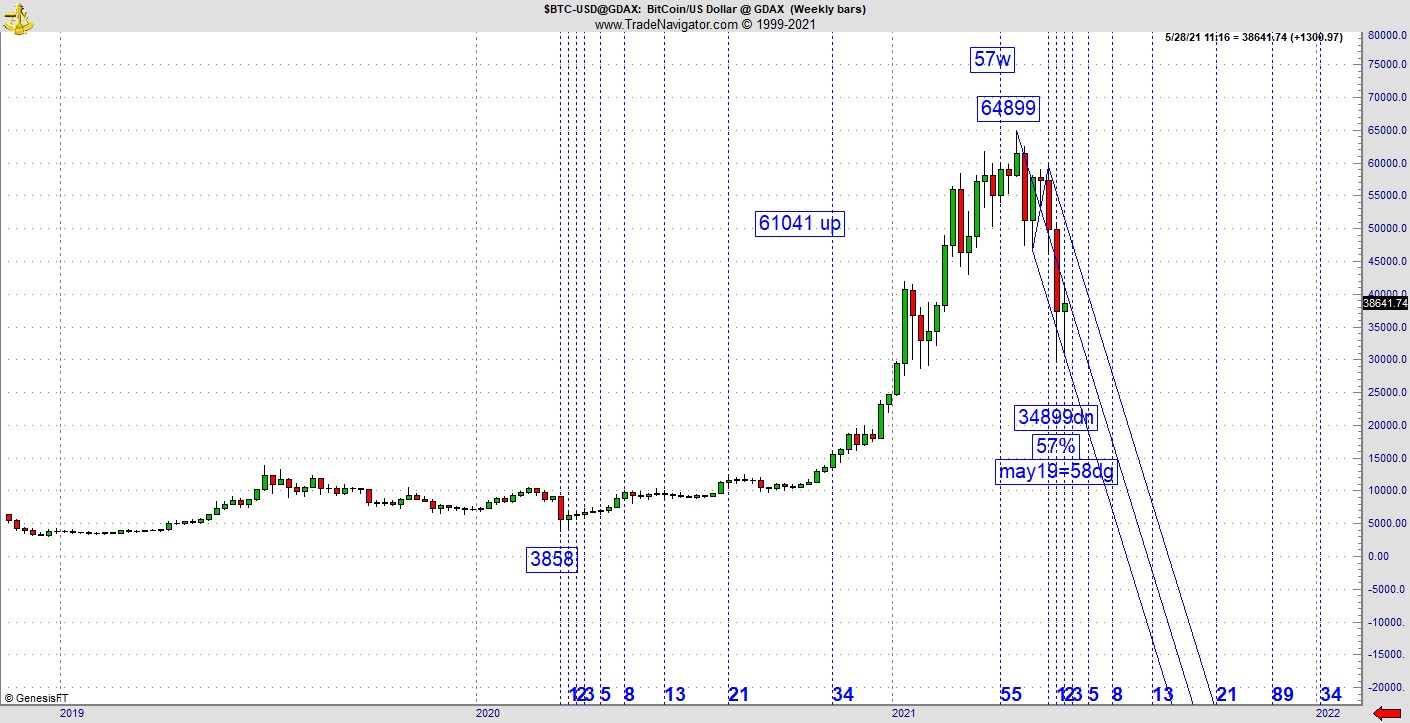
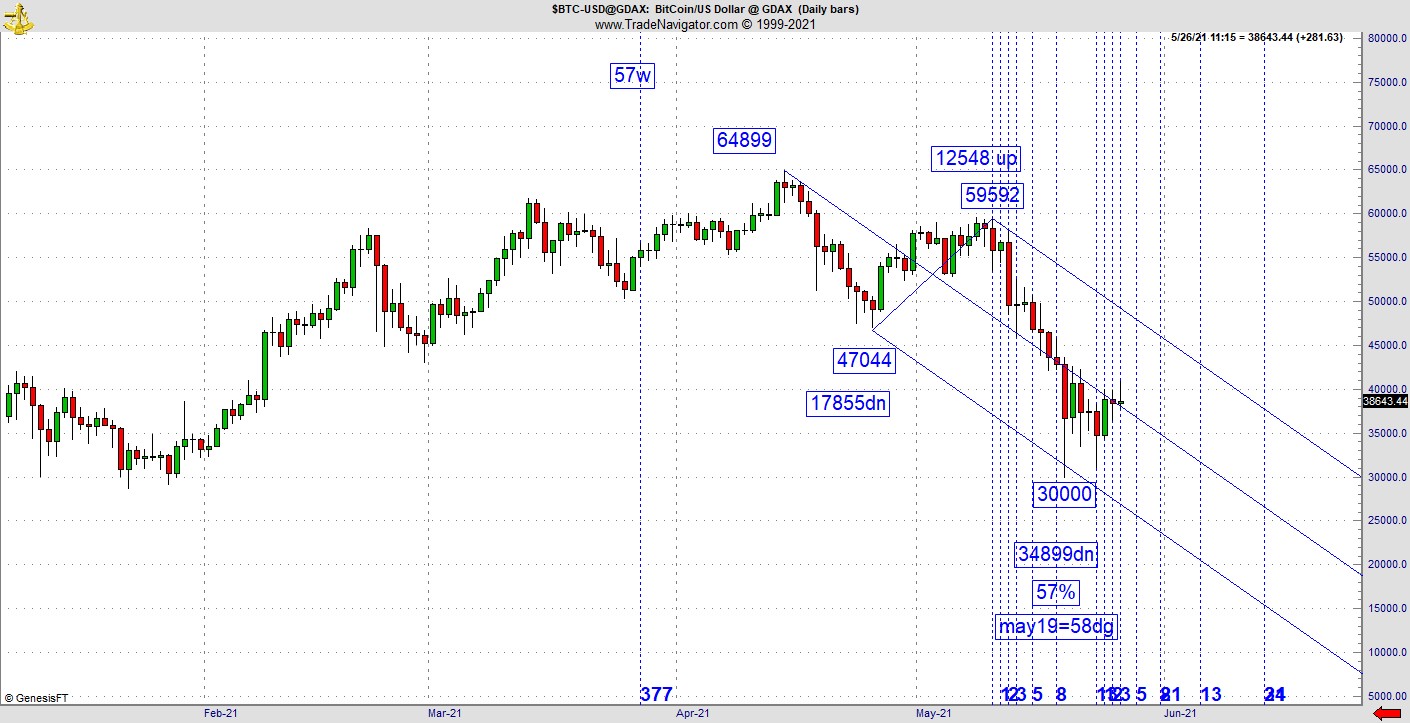
Here are the updated charts. The weekly shows a low last year of 3858, a move up of 57 weeks and a low at 57% retracement. Then the Gann calendar on the daily showed us a bottom at the 58dg vibrational day.
What have we learned? The market likely fears a bigger drop, which is why tech dropped last week. Have you noticed the market has been better since Bitcoin found the low? On this chart or any pattern just like this one should not attempt to catch a falling knife. Who usually buys when something like this happens?
The answer is nobody. The pattern recovers because bears cover causing the market to reverse course and move higher. Smart traders will wait for a retest of support before coming in, which is exactly what happened. So, I’ve added the intraday action so you can see how a good trading move develops. Anyone who tells you it bottomed and is going back up to a new bull leg is guessing at best and gambling at worst.
It amounts to the same thing. Real buying and more short covering came in on a test of a low that held. Keep in mind this chart stopped going down in all the right places, including the channel lines. Consequently, I had a very modest goal as I anticipate a move up to the declining channel line. But first it had to clear the midline. Managing a trade is really one step at a time. So far, this one has had little adversity since the retest.
The hourly shows us exactly what happened. From the bottom, short covering led to a move up to 42990, which was 12990. Then it had a very steep retracement, but the bottom held! If you get this revelation, it will absolutely change the way you look at charts. Do the math, you’ll find it’s a 91% retracement. A whole generation of traders was raised up in the 90s on Fibonacci retracements but if that’s all you know, you’ll miss the boat a lot. The 990 vibration specifically squared out at 91%, the retracement value. Here’s a hint, which is a good guide as this is not an iron law. When we see higher numbers like we do here at 90, the market telegraphs the level of retracement it might give us. This doesn’t always happen but materializes more then most of us realize. The buy materialized after the lower tail and lift on the retest at 91%.
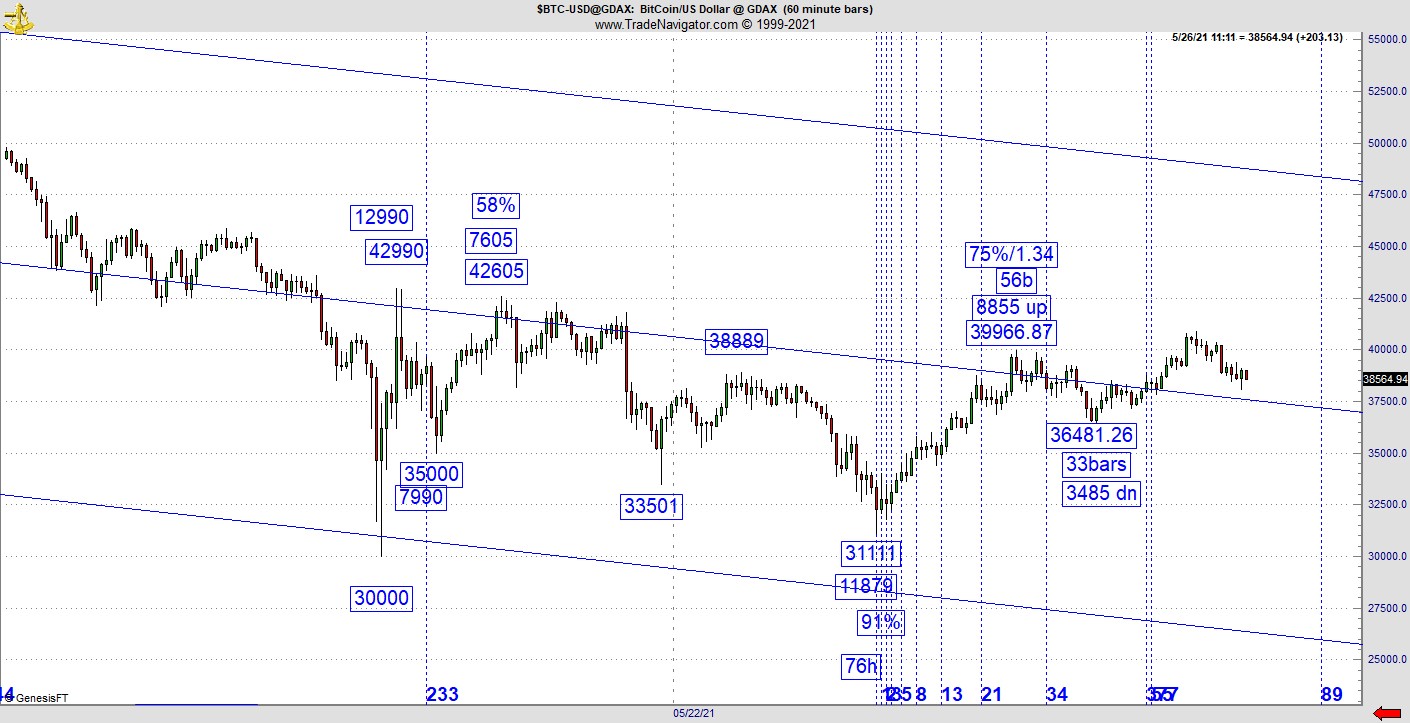
I can speak for myself and people I’ve trained over the years the common wisdom is when a retest leg hits for more then 61%, it's likely going to break down to a new low. That’s not necessarily the case. What about a retest of support? As long as support holds, its good. But support holding with a great square out? Even better. It gets to the first destination, which is the midline. On a 30-minute chart (not shown) it's 56 bars up to a near-term range of 8855 up. So that squared out. It also hit for a slash line at a 75% retracement and inverse of 1.34. Why is that important? On the 30 minute its 33 bars down so it squares out with the inverse of the retracement. Now it's consolidating at the midline, which is somewhat bullish right here.
Could it be we are in the development of a new sustained leg up? Sure it can, especially with the really good vibrations we’ve discussed last week and here as well. But there is a caveat. While the weekly chart has great readings, its still smaller than the 80-year 4th turning war and revolutionary cycle we’ve spend so much time discussing over the past year. All I can tell you is there is not anything yet manifesting on this chart to divorce the bullish case. Don’t love charts that don’t love you back.
If this calculation were to be violated, not only would I become bearish, but the crowd may very well panic. If a great relationship that has formed over the past week gets violated at any time going forward, it could fall an exceptionally long way.
Not only did I want to see what was going on here because it was the big financial story last week, but the steep retracement low was a great teaching opportunity on how to navigate serious tests of support.
For more information about Jeff Greenblatt, visit Lucaswaveinternational.com.


