

Eight of the 11 S&P sectors finished higher for the week ending 05/28/21, states Bonnie Gortler of bonniegortler.com.
Five of them were stronger than the SPDR S&P 500 ETF Trust (SPY) +1.23%. Consumer Discretionary (XLY) and Communications (XLC) were the leading sectors, +2.55%, and +2.51%, respectively. Healthcare (XLV) and Utilities (XLU) were the weakest sectors, down -0.61% and -1.51%.
S&P SPDR Sector ETFs Performance Summary
Week Ending 5/28/21 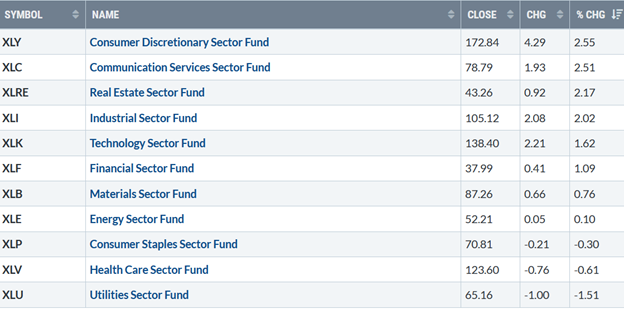
Source: Stockcharts.com
Continued positive economic data fuels the major averages higher last week. 10-Year Treasury yields fell, closing at 1.58%, staying in its trading range between 1.53 and 17.5 (Figure 1) since March. Rates closing below 1.53% are likely to ignite a further rally in growth stocks.
Figure 1: 10-Year Treasury Yields 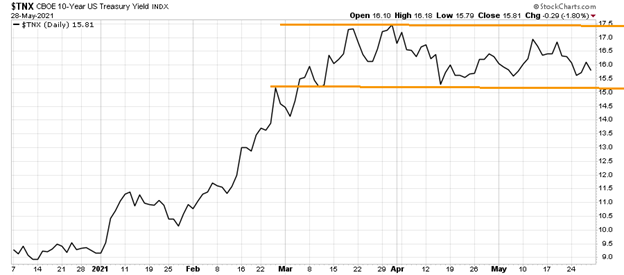
Source: Stockcharts.com
Technology and small-cap stocks led the market higher last week. The Dow rose +0.94% for the week, S&P 500 up +1.16%, breaking a two-week losing streak. Nasdaq was up + 2.06%, back-to-back weekly gains, while the Russell 2000 index rose 2.43%.
Weekly market breadth was solid for the second week in a row. Both the Nasdaq and New York Stock Index (NYSE) had more stocks up than down. The New York Stock Exchange Index had 2232 advances and 1152 declines. Nasdaq had 2884 advances and 1641 declines. New lows on the NYSE again closed under 20, implying low risk and more gains ahead.
Figure 2: Daily New York Stock Exchange (NYSE) New Lows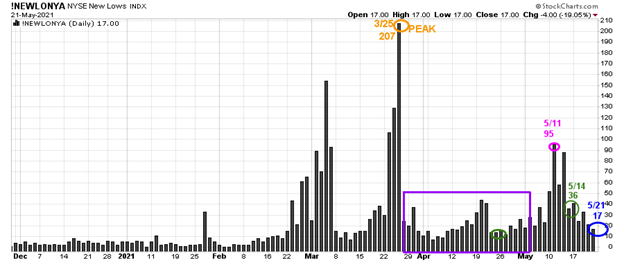
Source: Stockcharts.com
On 3/25, the NYSE New Lows peaked at 207 (orange circle) and immediately contracted (purple rectangle).
Watching new lows on the New York Stock exchange is a simple technical tool that helps awareness about the immediate trend's direction. In my book, Journey to Wealth, when the new lows are below 25, the market is very strong (very low risk and prices tend to rise). When new lows are between 25 and 50, risk is low, and the odds of a further rally are likely.
On 5/11, new lows on NYSE jumped to 95, their highest level since late March flashing a warning sign, but new lows immediately dropped to 36 on 5/14 (green circle), and on 5/28, they closed at 17 showing healthy underlying internal strength.
In sum, watch the new lows on the New York Stock Exchange. If new lows begin to expand and have a succession of days over 95, the 5/11 high will imply a potential weakness and more risk. On the other hand, if they remain low, the odds favor the advance will continue.
“Happiness is not in the mere possession of money; it lies in the joy of achievement, in the thrill of creative effort.” Franklin D. Roosevelt
ETFs to Monitor
Figure 3: Performance week of 5/21- 05/28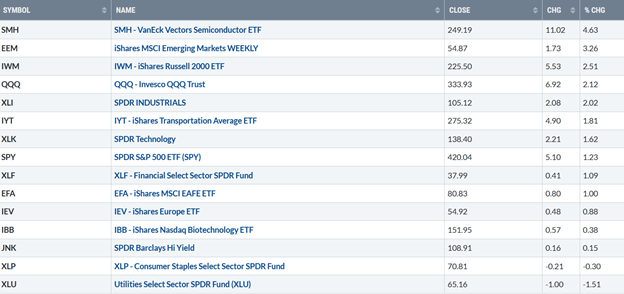
Source: Stockcharts.com
Positives
- The Russell 2000 (IWM), Invesco Trust Nasdaq (QQQ), and Semiconductor (SMH) all outperformed the S&P 500 (SPY) during 5/24-5/28, confirming a short-term bottom
- Semiconductors was one of the leading sectors for the second week in a row, gained 4.63% to gain relative strength vs. QQQ, Figure 11.
- IWM gave a new MACD buy, closed above its 50-day MA, and broke its short-term downtrend from May.
- The Nasdaq Advance Decline has broken the downtrends from February and April, Figure 5.
- Hi-Yield (JNK) and open-end high yield corporate bond funds show no downside pressure on down days and remain at or near their highs.
- The NYSE A/D line made a new high (Figure 6). Historically rarely does the market make a final peak when the cumulative advance-decline line makes a new high.
- Market sentiment based on CNN Fear and Greed Index (contrary indicator) rose only slightly from 34 to 38 last week. Investors continue to be cautious, showing fear despite the gains in the major averages.
Figure 4: CNN Fear and Greed Index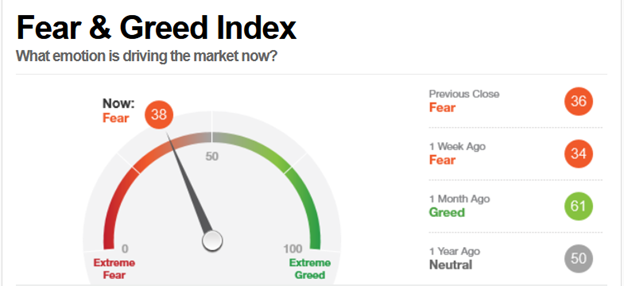
Source: CNN Business
Figure 5: The Nasdaq Advance-Decline Line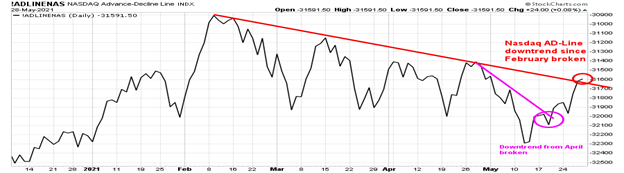
Source: Stockcharts.com
Figure 6: New York Stock Exchange Advance-Decline Line Top and S&P 500 Index Middle and MACD 12,26,9 Bottom 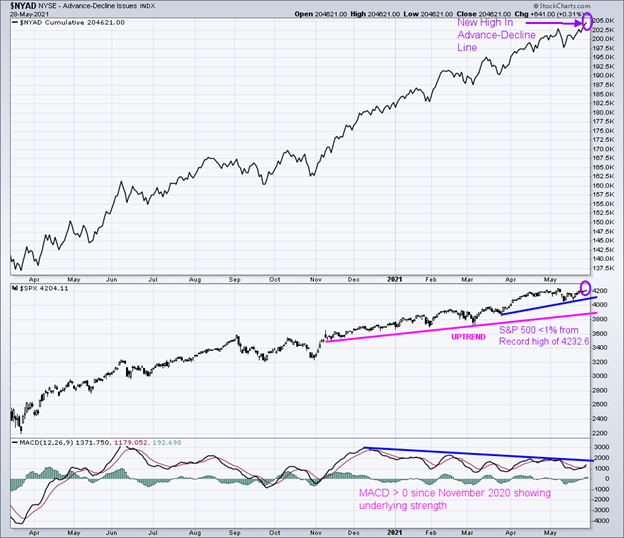
Source: Stockcharts.com
In the top portion of the chart (Figure: 6), you will notice The NYSE A/D line made a new high (purple arrow). Historically rarely does the market make a final peak when the cumulative advance-decline line makes a new high.
The advance/decline line (A/D) is one of my favorite technical indicators that measures market breadth. The A/D line shows how many stocks are participating in a stock market rally or decline. It represents a cumulative total of the number of stocks advancing versus the number of stocks declining. When the A/D Line rises, it means that more stocks are rising than declining (and vice versa).
The S&P 500 Index remains in an uptrend (blue line) from March (middle chart), closing at 4195.99, less than 1% from a new record high (purple circle). A close below the first support at 4100.00 would break the uptrend and warn of potential weakness. A close below 3723.34, the 3/4 low, would likely trip the sell stops and increase selling pressure beginning a more sustained decline.
The bottom chart is the S&P 500 and its 12,26,9 MACD, a measure of momentum. Notice how MACD remains >0 since November 2020, showing underlying strength. Keep an eye if the S&P 500 continues to rally. If MACD can penetrate the downtrend since December, this would be a further sign of strength and more gains to follow. On the other hand, it would be a warning sign if MACD cannot penetrate the downtrend and turns down.
Figure 7: CBOE Volatility Index (VIX) 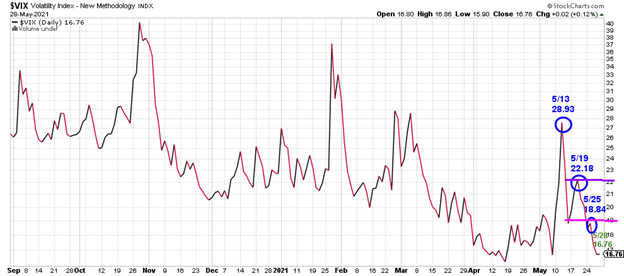
Source: Stockcharts.com
Volatility has quieted, as measured by The CBOE Volatility Index (VIX), after peaking on 5/13 at 28.93, continues to decline, closing at 16.76. A close above 18.84 would imply an increase in volatility.
Key ETFs to pay attention 6/1-6/4
Watch if the Russell 2000 (IWM), Invesco Trust Nasdaq (QQQ), and Semiconductor (SMH) continue to outperform the S&P 500 (SPY) for evidence of further gains or if they stall and turn down.
Figure 8: Daily iShares Russell 2000 (IWM) Price (Top) and 12-26-9 MACD (Bottom)
Source: Stockcharts.com
The top portion of the chart is the daily iShares Russell 2000 Index ETF, the benchmark for small-cap stocks, with a 50-day moving average (blue line) and 200-day moving average (red line) that traders watch and use to define trends. IWM made a low on 3/5 at 207.21 (orange circle), then peaking at 234.15. On 3/25, IWM successfully tested its low at 208.03 (green circle) and then stalled at 230.00, now key resistance (brown circle).
IWM is looking more attractive now, after breaking its short-term downtrend from April (purple line) and closing slightly over the first resistance of 225.00, rallying back to its uptrend line (pink) and also closing above its 50-Day Moving Average.
However, this week there is another hurdle to surpass. A close above resistance at 230.00 (blue line) would break the March downtrend and imply a test of the old high and potentially more. On the other hand, IWM will likely stop rising and turn down if IWM closes below 222.00.
The bottom half of the chart is MACD (12, 26, 9), a measure of momentum. After MACD broke the short-term downtrend from February (blue line), there was no thrust to the upside, and MACD gave a sell signal, turning down from above 0.
Last week MACD generated a new buy with a favorable rising double bottom formation, with MACD breaking its downtrend (purple line). IWM appears to be ready for another leg higher as it no longer has a pattern of lower lows, which is bullish. IWM turned up and closed above first resistance at 225.00 and now is likely to challenge 230.00 and potentially surpass that level. A close below the March low at 207.21 would imply a more serious decline.
Figure 9: Daily Invesco QQQ Trust Nasdaq (QQQ) Price (Top) and 12-26-9 MACD Bottom)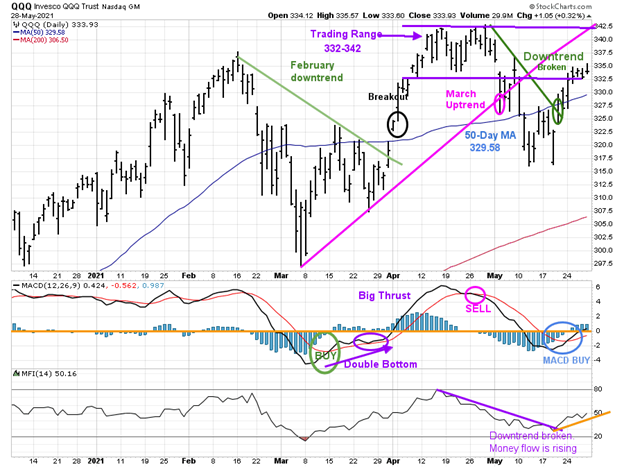
Source: Stockcharts.com
The top part of the chart shows the daily Invesco QQQ, an exchange-traded fund based on the Nasdaq 100 Index with its 50-day moving average and 200-day moving average. On 3/31, QQQ broke the downtrend from February (green line) and then gapped higher (black circle), breaking out to the upside. QQQ then stayed within a trading range for three weeks (purple) before a downtrend developed, turning the short-term trend down.
The bulls got excited last week, breaking the downtrend from April (green line), shifting the short-term trend to up QQQ and a rise of 2.12%. Its positive money flow continues to rise with the price.
The middle chart is MACD (12, 26, 9), a measure of momentum. After the March buy (green circle) and big thrust to the upside, MACD gave a quick sell and fell below 0. Last week MACD turned up from an oversold condition, below 0, and is now on a buy.
I expect QQQ to work its way higher toward the upper end of its trading range of 342.00. On the other hand, a close below 307.50 implies a more serious decline and negates the bullish pattern.
Figure 10: Daily Vaneck Vectors Semiconductor (SMH) Price (Top) and 12-26-9 MACD (Bottom)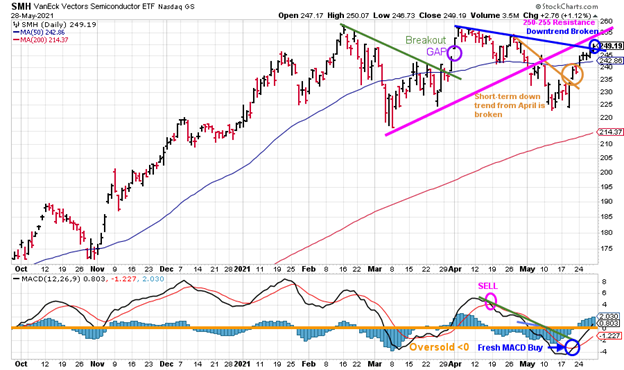
Source: Stockcharts.com
The top chart shows Semiconductors (SMH) broke its March downtrend on 3/26 (green line). SMH then gapped up (purple circle), breaking out to a high of 256.68 on 4/8. SMH did not follow through to the upside and reversed.
Semiconductors (SMH) was strong, a leading sector for the week up +4.63%. Similar to QQQ, SMH broke its April downtrend, shifting the trend to up, bullish for the near term. Resistance is at 250.00 followed by 255.00. Support is at 242.00 followed by 230.00.
The lower chart is MACD, a measure of momentum. MACD remains on a buy. As expected, the MACD broke the downtrend last week. Look for continued strength in SMH, which bodes well for the broad market. A close below 240.00 would be a warning sign the present rally will come to an end.
Figure 11: VanEck Semiconductor Invesco QQQ Trust (SMH/QQQ) Relative Strength Ratio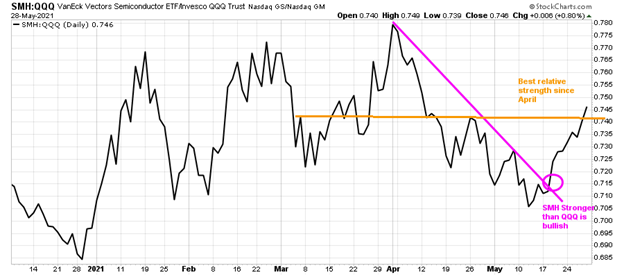
A rising line means the SMH is stronger, and if falling, the QQQ is stronger. When the Semiconductors (SMH) are stronger than the Nasdaq (QQQ), this usually bodes well for the stock market. The SMH/QQQ ratio peaked at the end of March, but SMH is now showing its best relative strength, which is bullish.
Summing Up:
Technology, small-cap, and semiconductors (QQQ) stocks led the market higher last week. Momentum patterns have turned favorable. Market breadth is promising, with another new high made in the NYSE Advance-Decline Line. The Nasdaq Ad-Line is improving. Growth stocks have stabilized and improved momentum patterns developing, which could spark even more gains in the future. The tape is positive, giving the bulls control. I am looking for another leg up unless there is no follow-through to the upside and the early March lows are taken out. The key closing numbers to watch for potentially a significant decline are below 207.21 for IWM and below 307.50 for QQQ.
Remember to manage your risk, and your wealth will grow.
I would love to hear from you. If you have any questions or comments or would like to chat about the market, e mail me at Bonnie@Bonniegortler.com
Learn more about Bonnie Gortler at BonnieGortler.com
Disclaimer: Although the information is made with a sincere effort for accuracy, it is not guaranteed that the information provided is a statement of fact. Nor can we guarantee the results of following any of the recommendations made herein. Readers are encouraged to meet with their own advisors to consider the suitability of investments for their own particular situations and for determination of their own risk levels. Past performance does not guarantee any future results.


