

The path of least resistance for stocks remains up for now, as the S&P 500 (SPX) finally closed above the 4200 resistance area, although money continues to rotate from past leadership sectors to new areas, says Joe Duarte of In the Money Options.
Moreover, a new trading pattern is emerging where stocks are moving rapidly higher for shorter periods of time before being aggressively sold. This suggests that a shorter-term trading mindset is in order.
Dissecting the Rotation
This market is both a rotation and an uptrend simultaneously. Specifically, much of your trading performance will be the result of what stocks you pick, when you buy them, and when you sell them. Of course, that sounds like what you would consider in any market. But here is what I mean.
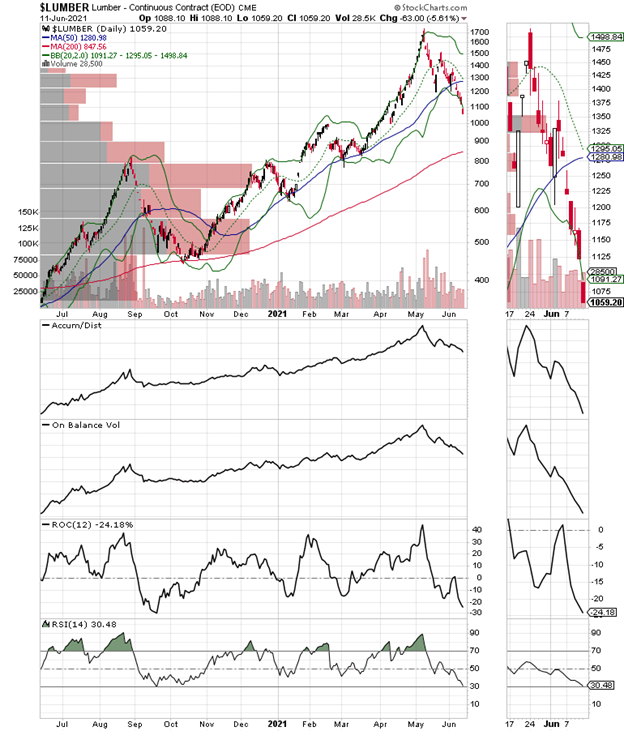
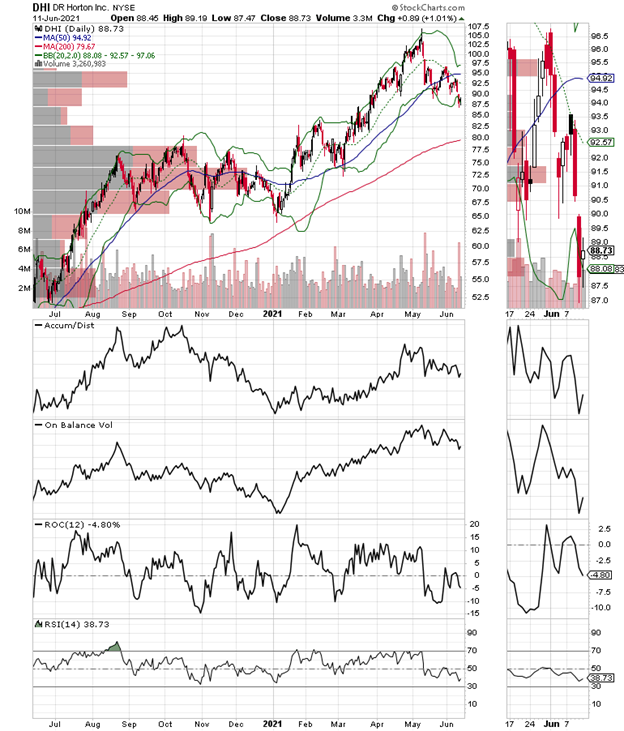
Let’s look at the unfolding market rotation in detail. Over the last few years, we’ve seen the housing stocks move higher as interest rates have dropped and homebuilders have managed supply quite handily. Yet, over the last few weeks, as the increase in lumber hit overdrive, the homebuilder stocks, despite bullish guidance and excellent earnings and revenue beats have collapsed. Consider the chart of D.R. Horton (DHI). The stock is down nearly 20% since topping out near $107 in late April. Moreover, the selling is now being driven by increasingly active short sellers, as highlighted by the rapidly falling Accumulation Distribution (ADI) without any bounce in On-Balance Volume (OBV). And adding to the negative vibe, DHI has little meaningful support above $80.
Meanwhile, other heavily shorted stocks, such as Academy Sports and Outdoors (ASO), which I own, continues to foil the shorts, at least in the present. Specifically, compare the divergence between in ADI and OBV in the shares of ASO. Whereas in DHI (above) both ADI and OBV are falling in tandem, in the case of ASO, ADI continues to fall while OBV rises. Moreover, since price is the ultimate indicator, look at the price action on ASO, which keeps rising.
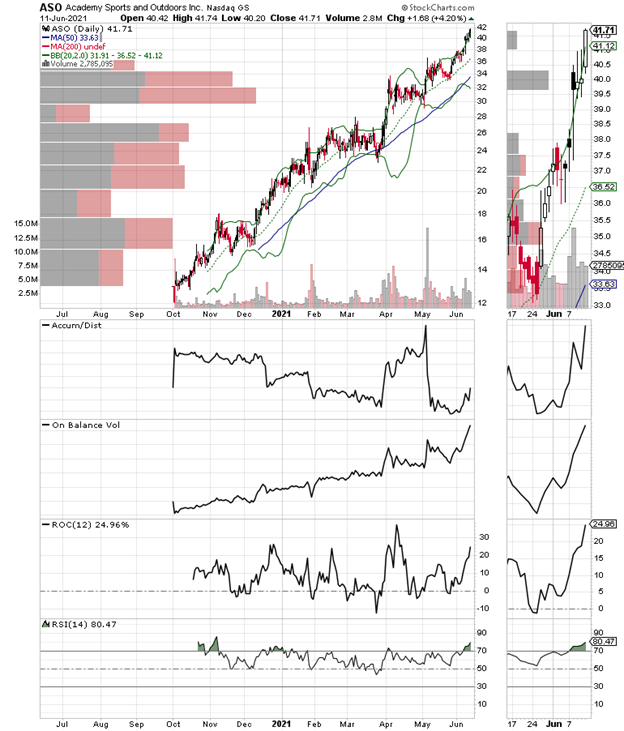
In addition, whereas DHI and the homebuilders are falling despite good news, ASO continues to rally, also on good news. The company just delivered record earnings and revenues and again gave upbeat future guidance. Still, even though ASO is in a long-term uptrend, the stock is moving up in a jagged chart pattern, which can be confusing and can lead to whipsaws for traders. So, there are two ways to trade ASO and similar stocks that may be moving higher, albeit in a choppy trading pattern in this market:
- One choice is to give the stock more room with a sell stop of maybe 8-10% versus our customary 5-8%
- The other choice is to try to time the rallies and fade them while buying the dips as long as the stock holds above key support such as that provided by the Volume by Price (VWP) bars.
Either way this stock may require adjustments to normal trading approaches because of the way the general market is behaving. Finally, in the case of the homebuilders, some sort of bounce is possible at any time, given the heavy selling of late, plus the quiet decline in bond yields.
So, what’s the bottom line? In a rotation it’s important to dig deep into both a company’s fundamentals as well as to pay attention to technical details, including ADI, OBV, and very specifically how the stock responds to news. Finally, consider that this is a rapidly evolving rotation and that today’s market darlings could become tomorrow’s dogs in a hurry.
SPY 424-425 is the New Resistance Level
Slowly but surely call buyers have been wearing down the bears in the S&P 500 SPDR ETF (SPY) options market with the net effect being that the overall market still has a bullish, albeit choppy trend.
So, for now the slog at 420 seems to be over and we seem to be in a new chop zone between 422 and 425 during the weekly SPY expirations (M, W, F).
Thus, a failure at 425 would likely lead to some selling and increases in put buying, which would force the algos to sell puts and sell stocks and stock index futures in order to hedge. Moreover, if SPY fails to stay above 420, we could see some heavy selling since there are still large put sales in the 420 area.
Leidos Finds Its Way Back Up
Shares of government defense and infrastructure contractor Leidos (LDOS) delivered a breakout last week that has been building for some time.
As I boarded my plane to the MoneyShow in Orlando last week, I had to chuckle because the TSA x-ray scanner at Dallas International that I went through was a LDOS. Sure, this is one of those stocks that’s always on my watch list; mostly because when it starts moving higher it often delivers at least a few days, if not weeks of gains. So, I had a closer look and found some excellent technical characteristics that suggested that it should move higher; which it did on 6/10.
LDOS has an interesting business. It sells software and hardware mostly to the US government, which is deployed throughout the armed forces. Aside from pure defense tech, however, LDOS sells lots of maintenance and business running/record keeping subscriptions and related hardware to state, local, and the federal government. As a result, it has a steady income pipeline and always boasts of pending future contracts, like a recent Air Force contract, which will net over $100 million throughout its lifetime.
There is usually no major reason for the stock to jump or to fall since it’s always making money. Thus, when the technicals are favorable it makes good sense to trade the stock, which is why I recently recommended it. Specifically, the Accumulation Distribution (ADI) indicator has been down trending of late while the On-Balance Volume (OBV) has been moving higher in an area of price congestion. That’s a sign that short sellers are trying to bring the stock down and are not being successful. Moreover, it suggests that algos are buying the stock.
The bottom line is that LDOS has room to move to the $112 area over the next few weeks. What happens there will be the deciding factor as to the next trading decision. For now, it looks as if LDOS is in one of those periods where momentum is behind it.
I own LDOS as of this writing.
Overbought NYAD Continues to Move Higher
As I’ve noted for the past several weeks, the New York Stock Exchange Advance Decline line (NYAD) continues to make new highs, which means the uptrend in stocks remains intact. Nevertheless, the advance in stocks remains choppy due to the continued rotation out of recent leaders and the short-term nature of the advances in stocks that are trying to become long-term leaders. Moreover, the RSI for NYAD is now well above 70, a decidedly overbought reading.
Certainly, NYAD can remain overbought for some time. But usually what happens is that the advance either slows and the market consolidates, or we have some sort of reversal. We’ll have to see what happens here, but this indicator is very reliable, so some caution is warranted.
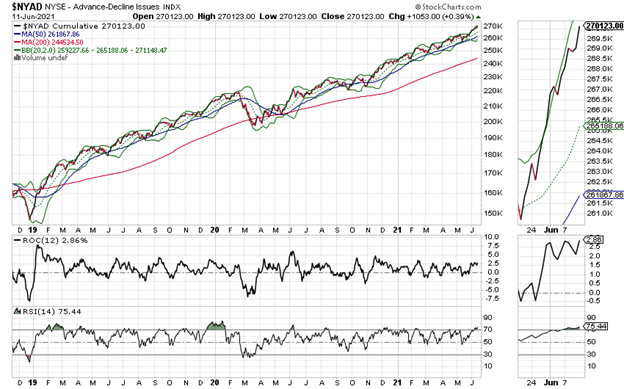
Still, regardless of the RSI reading, as long as NYAD continues to make new highs, remains above its 50- and 200-day moving averages and its corresponding RSI reading remains above 50, the trend remains up. This combined set of observations has been extremely reliable since 2016 and shows no signs of becoming unreliable as of this writing.
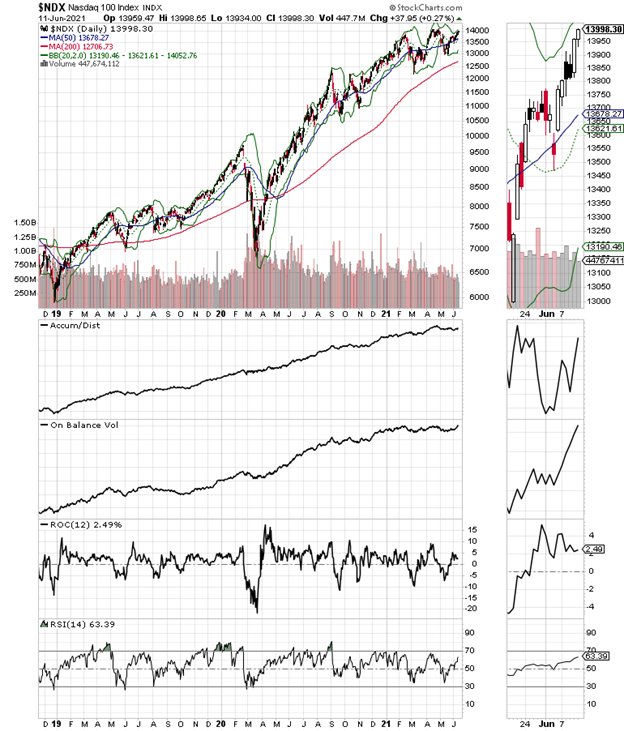
The Nasdaq 100 index (NDX) moved nicely higher last week but still has resistance near 14,000. But unlike NYAD, the RSI for NDX is not overbought so this index still has some upside room before things get clogged up.
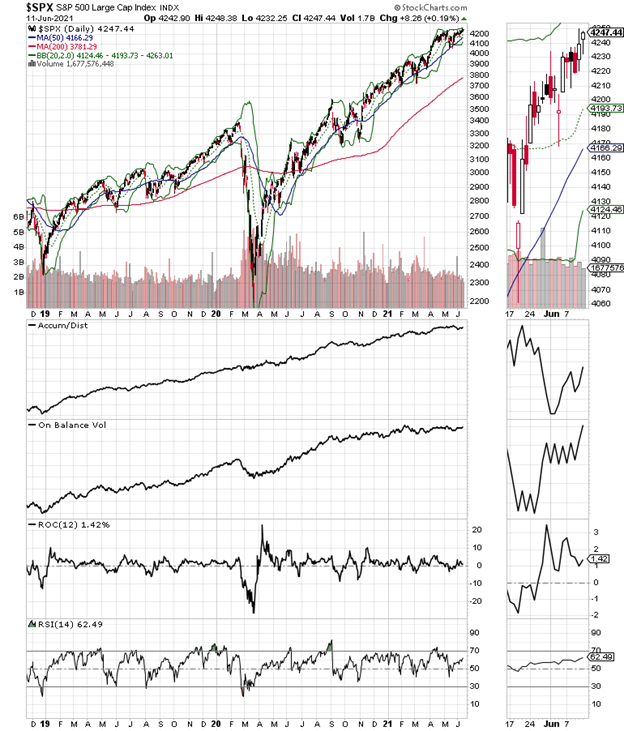
The S&P 500 finally closed above 4200 and is likely to have a bit more room to rise in the short term because it’s not overbought yet; similar to what we’re seeing in NDX. This is a short-term positive.
To learn more about Joe Duarte, please visit JoeDuarteIntheMoneyOptions.com.


