

Twice this month already, S&P 500 (SPX) has had a sharp one-day decline amidst deteriorating internal factors in the market, yet the Index quickly reversed back upward the very next day asserts Larry McMillan of Option Strategist.
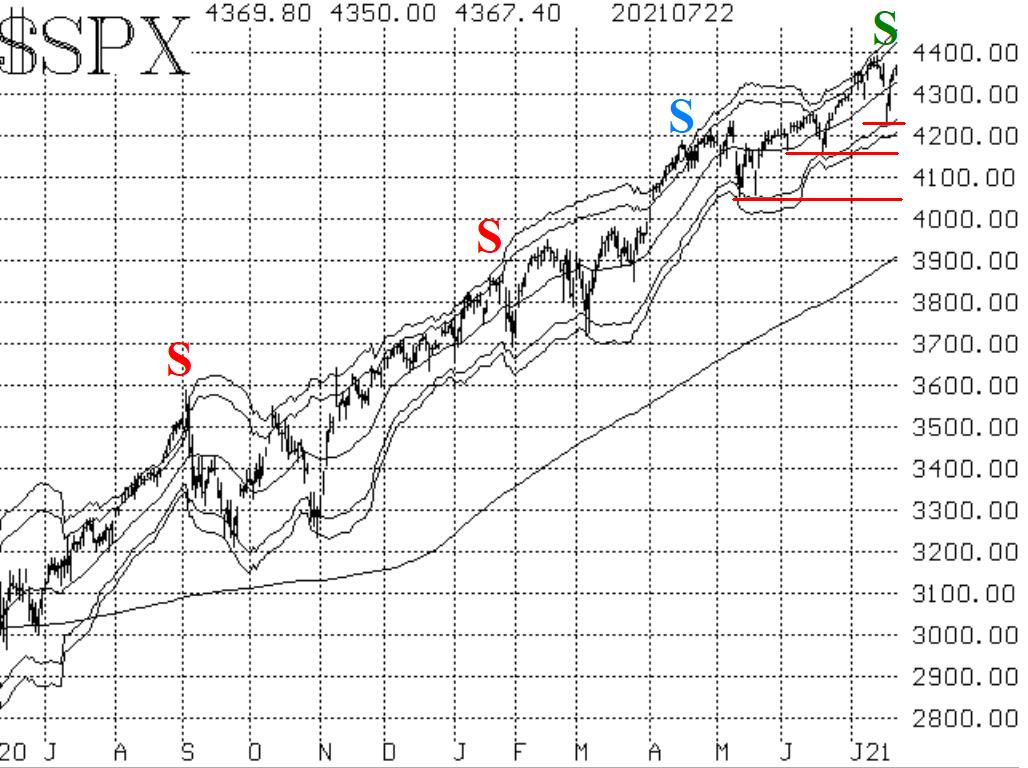
The lows of July 19th at 4233 are now a support area, with support below that at 4165 (the June lows) and 4060 (the May lows). Those support areas are denoted with horizontal red lines on the chart in Figure 1.
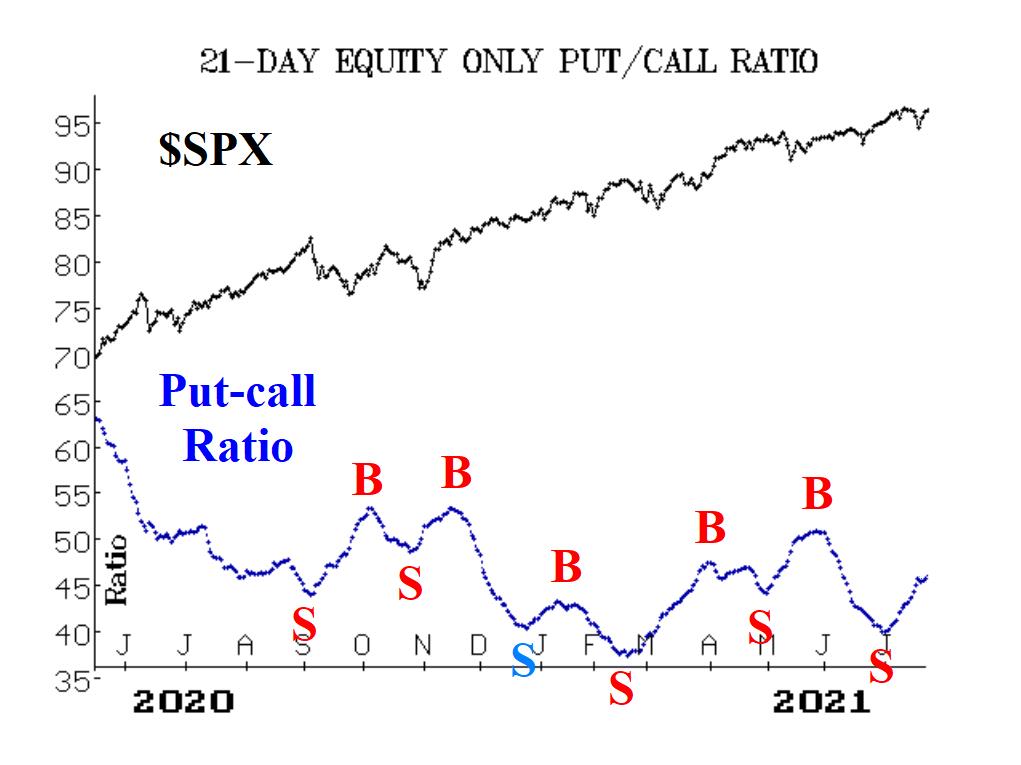
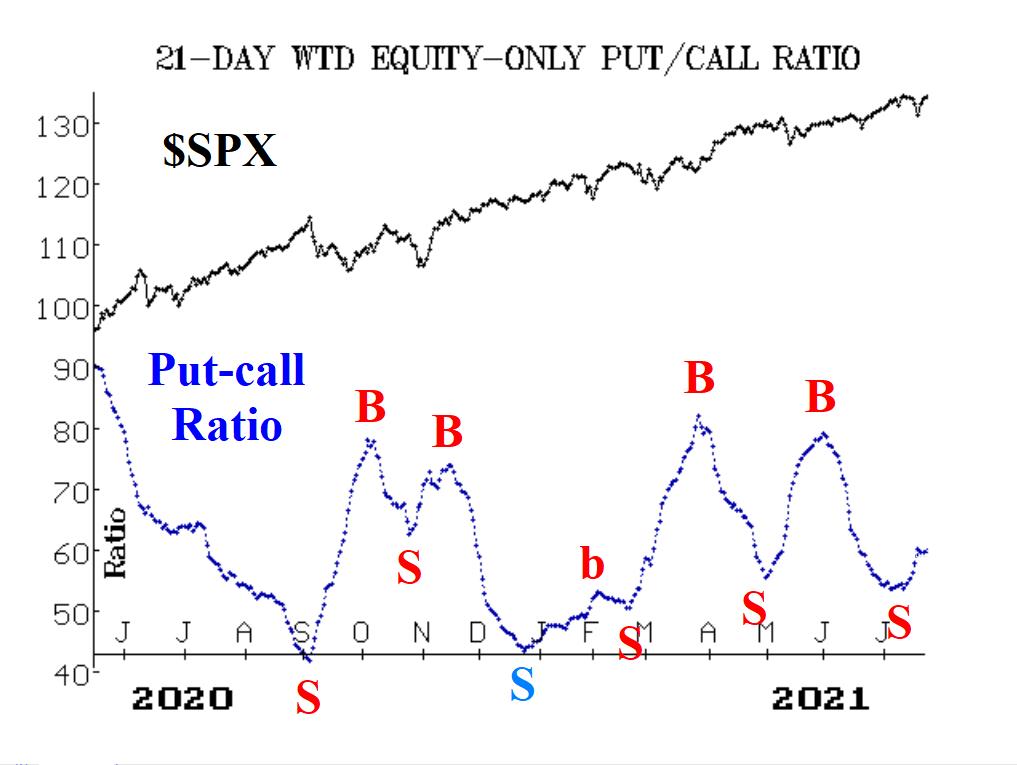
The equity-only put-call ratio charts are still rising and thus are still on sell signals. Yes, there has been some sideways movement in the last few days as the indices have recovered from the lows of July 19th, but our computer analysis programs are steadfast in "saying" that these ratios are still on sell signals
At the close of July 19th, the "stocks only" breadth oscillator was extremely oversold. Then, two strong days of better than 3,000 advances over declines on July 20th and 21st, moved both breadth oscillators to buy signals. Thus, it was surprising to see breadth return to a negative status on July 22nd. But, for now, these oscillators are on buy signals.
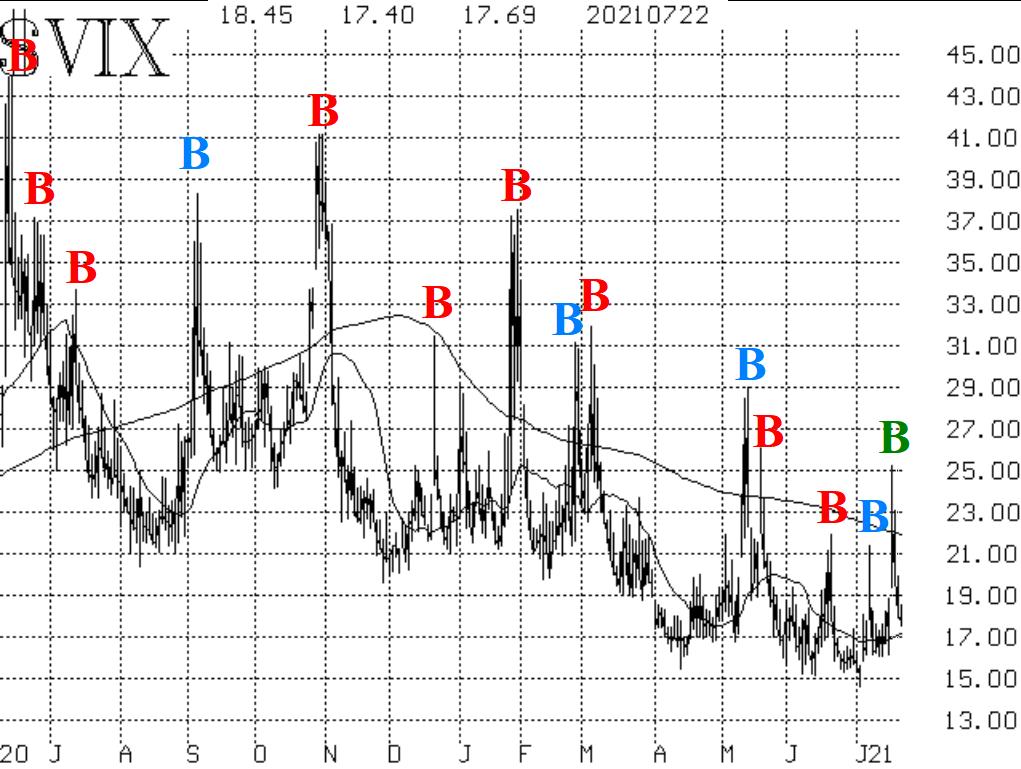
Implied volatility, on the other hand, has mostly remained friendly to the stock market. For now, CBOE SPX Volatility Index (VIX) is on a "spike peak" buy signal as of July 20th. Moreover, the trend of VIX is lower, and that is bullish for stocks.
In summary, myopically looking at the SPX chart, the picture is bullish. That is confirmed by implied volatility. However, the other indicators are either on sell signals or are struggling to maintain bullish signals. So, with the negative divergence still in place, we are respecting the trends of SPX and VIX, but will take bearish signals if they are confirmed.


