

For late July, there’s a lot going on this year. Certainly, no paint drying sessions yet thank goodness. We have a few market issues to cover and then I’ll break down the action the finer details of how the intraday Fed trade went down, explains Jeff Greenblatt of Lucas Wave International.
First of all, there is still a nagging divergence given the Transports was trying to breakdown while oil is attempting to break higher. Think about it, the higher oil prices go, the more pressure might be put on airlines, trucking, and obviously, the American consumer. All of this while the Dow, NDX and SPX are sitting at or near new all-time highs.
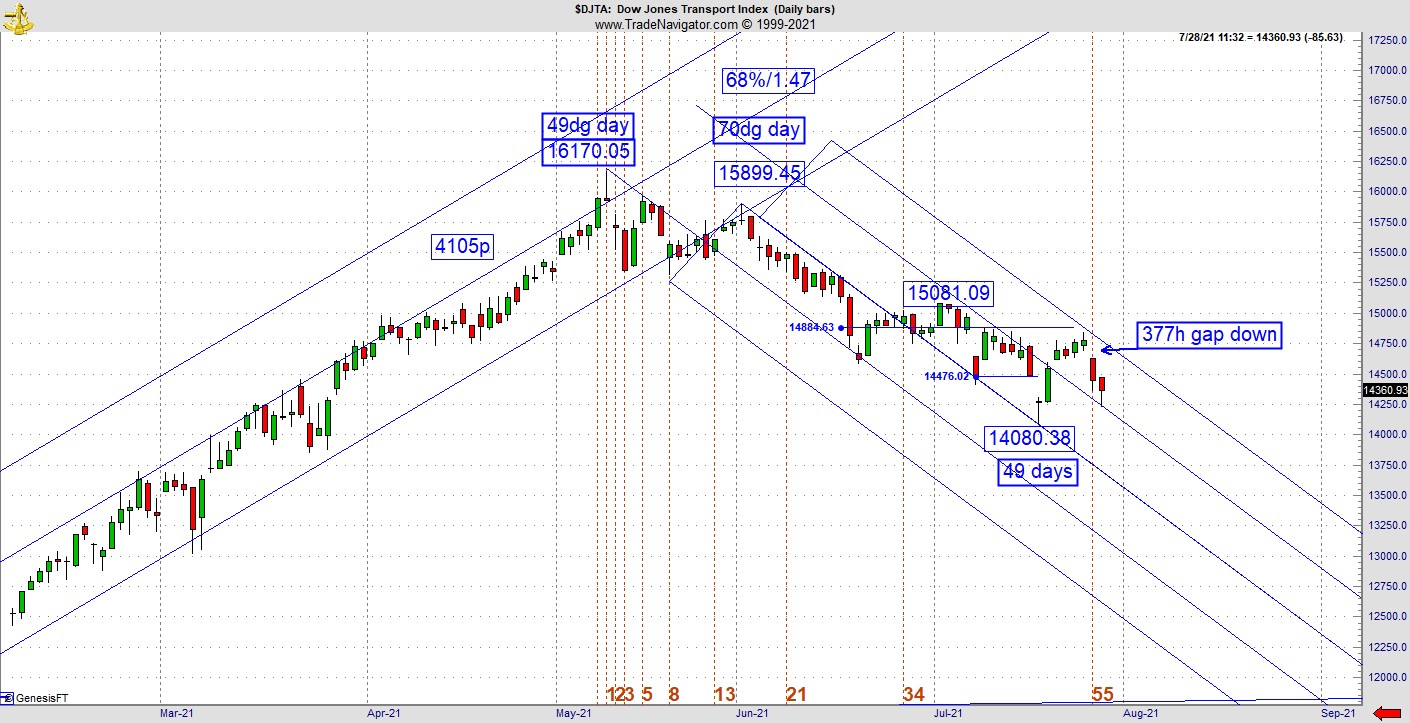
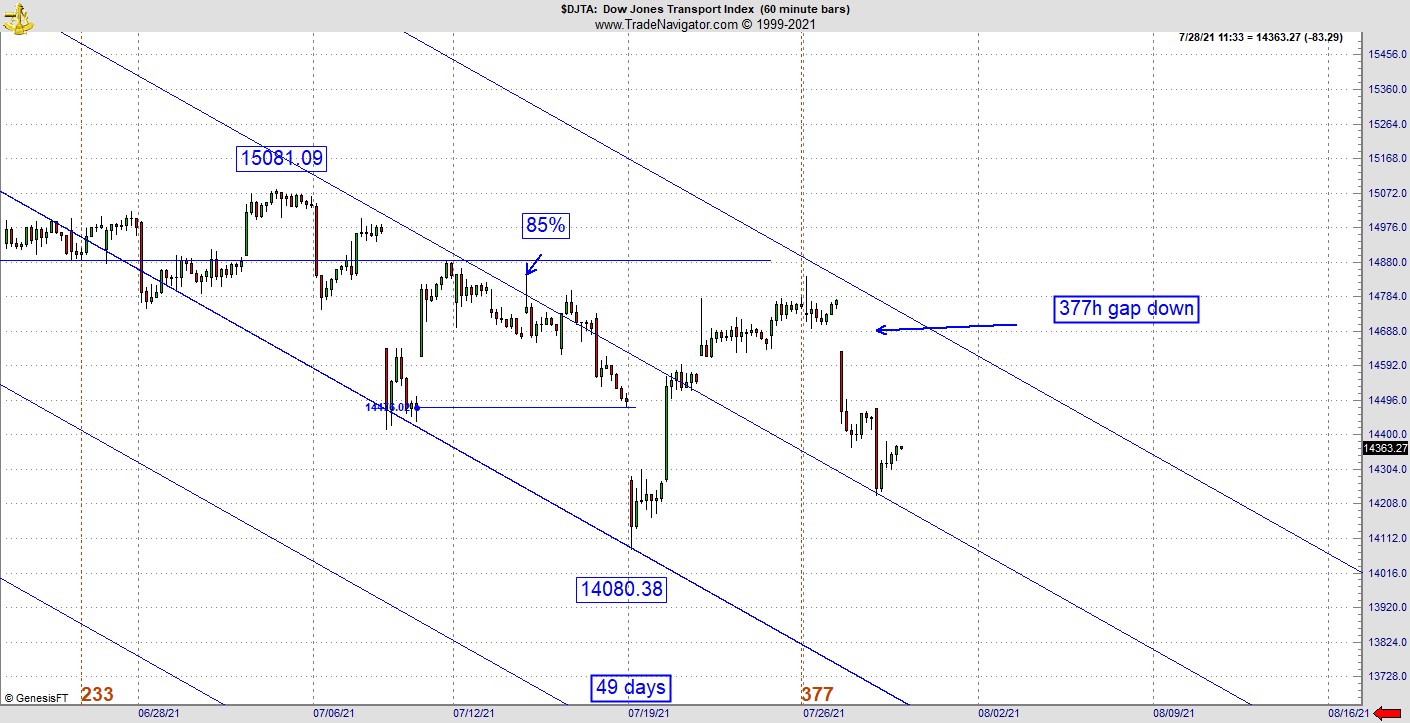
I’ve previously shown you how the Transports started rolling over based on a vibrational replication reading. As we know the Transports broke below July 8 support before recovering. My view was another test of that critical area. In what will be the most interesting chart of the day, the Transports broke down at the key Fibonacci 377-hour point. That’s where the gap down was.
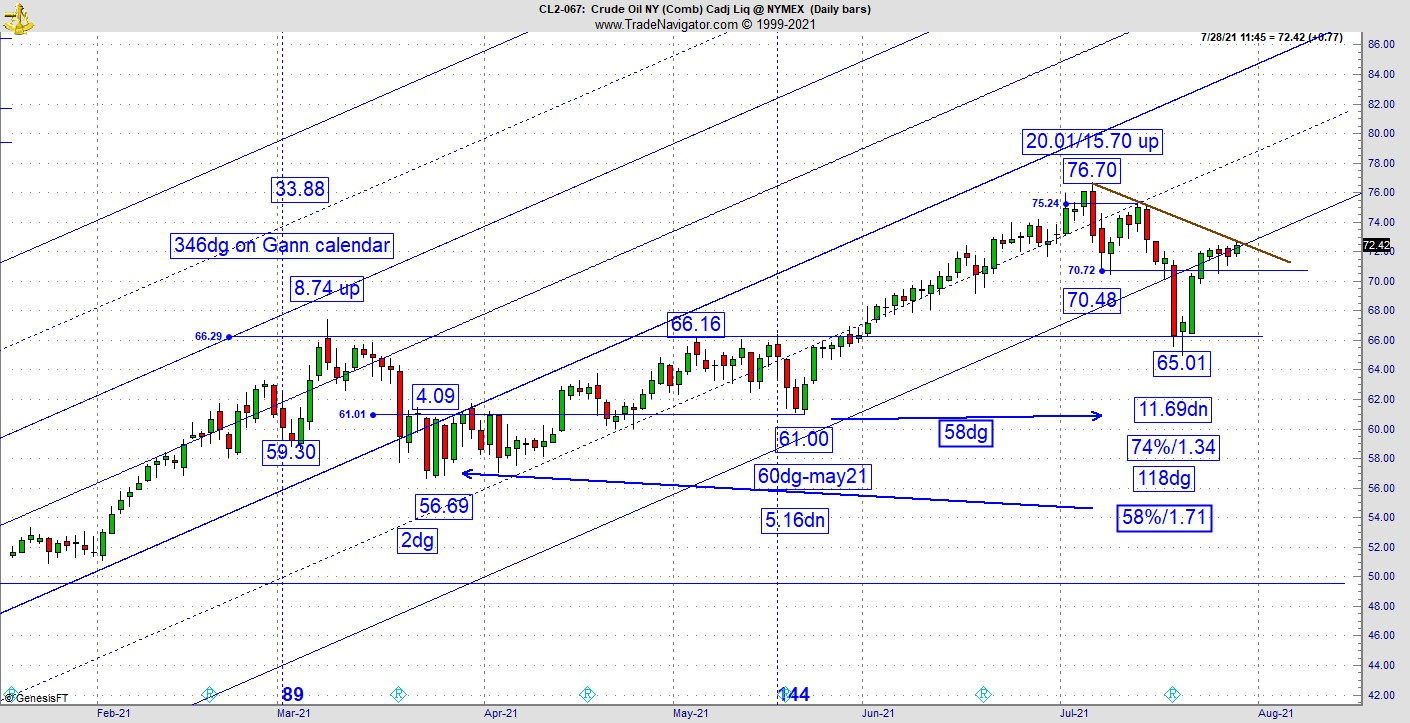
On the other side of the coin the oil chart is now sitting at one of the more interesting points you’ll ever see. Why? As it turns out the price action at the Fed zero hour was hugging a longer-term uptrend channel line at the same time it's testing the breakdown trend line that has been in place since July 6. All I can tell you is the foundation built over the past week looks strong, including a great flip of polarity based on strong Gann calendar readings. This is a major inflection point. There’s a good chance we can connect the dots from the weak Transports to the decent-looking oil setup.
That being said, I don’t think Powell offered too much in the way of clarifying anything. They seem to be proceeding along with the understanding the economy keeps improving while at the same time the CDC is looking to put mask mandates back in place. We know how much prior lockdowns hurt the economy and I don’t think they are addressing this issue properly. With the amount of money that has been printed over the past year, many are questioning his comments that inflation is “transitory.” Concerning the Fed, I believe they’ve raised more questions than they answered.
The best thing I can do is give you information you won’t get anywhere else. So many intraday traders are super cautious about trading Fed announcement day. For years, I had a standing policy of never attempting to trade one of these roller-coaster events. That is no longer the case as my new intraday clock has provided clarity I’ve never had before. Seeing is believing, right? It’s obviously too late to trade this sequence, so the reason I’m showing you this is so you can see some of the tendencies the market offers.
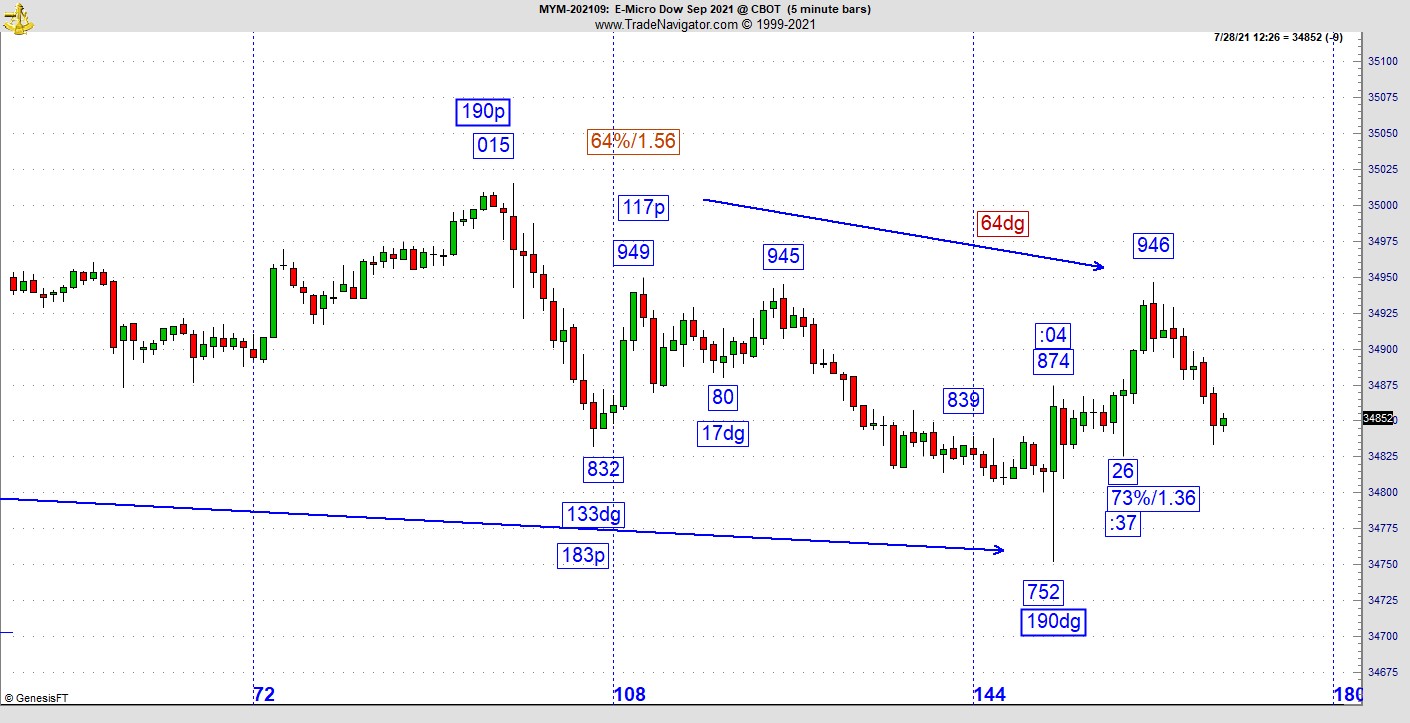
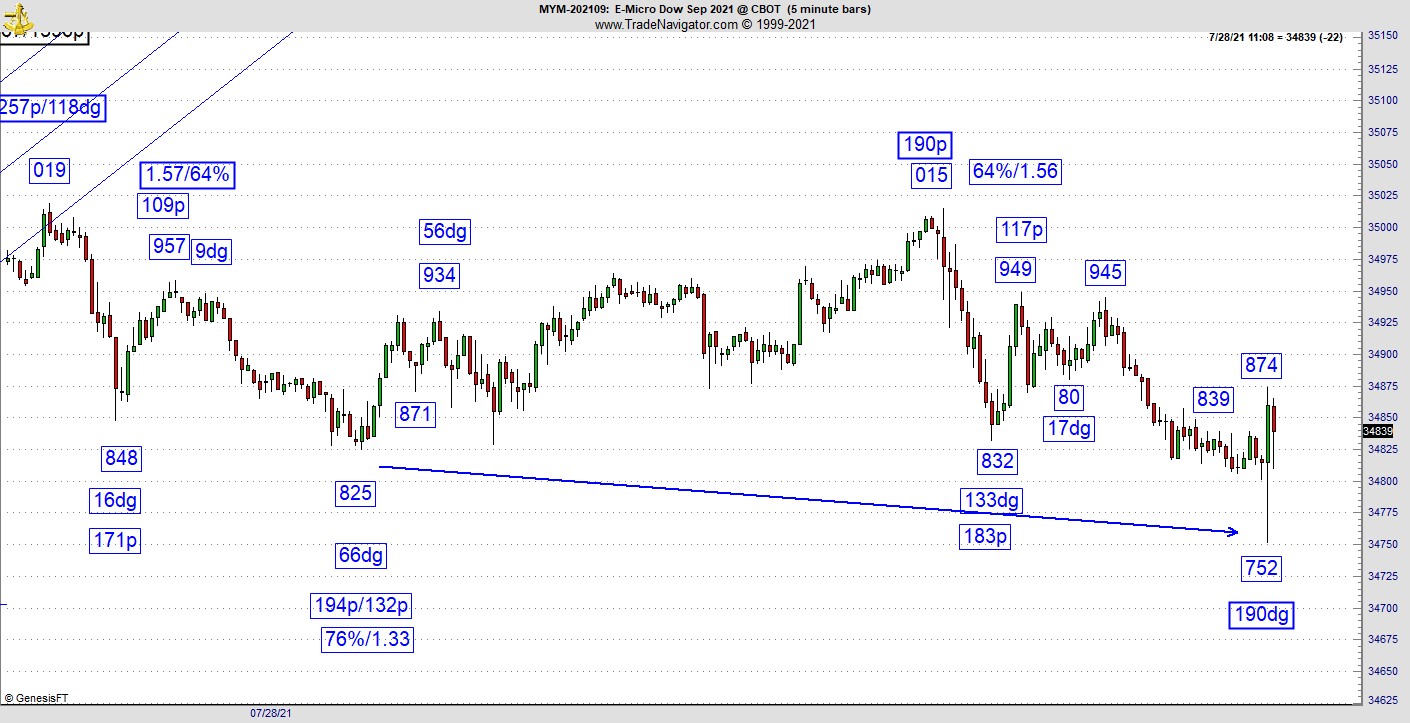
Keep in mind, this is all intraday stuff and has little to do with the bigger picture as the market reversed. The intraday clock captured both ends of today’s event, which led to legs of 194 points up followed by 112 points down in less than 90 minutes. First of all, from the low in the overnight Dow futures action to the opening bell high was 190 points. That’s price. From the overnight low to the Fed zero hour was 190dg on the intraday clock, that’s time. Price and time perfectly balanced, which led to higher prices. Then as we go down to the one-minute chart we had a retracement of the move off the low with the inverse creating the slash line of 73% and 1.36 turned up precisely at :37 minutes after the hour. Finally, from the retest of the high, which failed at 34949, which produced a slash line at 64% and 1.56, the second phase of the Fed trade peaked at 64dg from the secondary high. This is the kind of precision I’ve been working to find for years. As I told you in previously posts, the intraday clock works similar to the way the daily Gann calendar does but has the potential to provide the kind of clarity one can never get from the usual oscillator or band-type indicators offer.
Getting back to the bigger picture, the US dollar is hanging on and still has the potential to go higher even as it’s been lower lately. Bitcoin is testing the highest level of resistance from June 15 since the initial bottom on May 19. Here is yet another key inflection point. With all these inflection points the market is still digesting a complex landscape of geopolitical and domestic issues. The good news is we should be close to the market revealing its hand in the coming days.
As far as trading intraday futures on a Fed announcement day, one needs to proceed with caution as it's easy to lose hard-earned gains in a flash. One really needs to know what they are doing, or it is best to keep the powder dry until the dust settles. But if you can get the right information, you can follow Larry Pesavento’s advice to trade exactly what you see. Price and time vibrations do provide that clarity.
For more information about Jeff Greenblatt, visit Lucaswaveinternational.com.


