

Since early this year, patterns in meme stocks have been a phenomenon to observe, states Garrett DeSimone of OptionMetrics.
GameStop, Nokia, and others reached over 700% in implied volatility in the peak of their trading frenzies, as organized retail traders took to Reddit and other social media platforms.
Many of these retail traders capitalized on high short interest, which in turn created a squeeze that sent prices soaring. As an example, GameStop reached almost $350 a share at the end of January this year, from about $13 in December of 2020. These short squeezes arose from supply and demand imbalances. As news triggered a price increase (or organized buying), shorts needed to cover their positions by purchasing the stock, supporting continued price ascensions.
Shorting is not free. It involves borrowing a stock that an investor does not own and paying a fee, or borrow rate, which is expressed as an annual percentage. For liquid securities, these fees are low, averaging about 0.25%. However, stocks with significant short interest can become hard-to-borrow (HTB) or nearly impossible-to-borrow (ITB) with rates exceeding 25% for some annually.
Implied borrow costs reflect the market makers’ costs of shorting in the option market. The borrow rate represents the costs of shorting maturities across various horizons. The table below plots the standardized 30- and 90-day borrow rates for the premier meme stock, GameStop (GME).
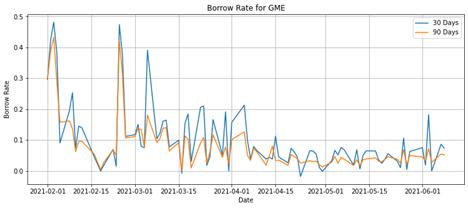
During early February, GME was ITB with a rate near 50%. This was a result of the squeeze put on the stock by retail traders. However, since April borrow rates have stabilized near 5%, for the most part. This is consistent with increased liquidity by way of market makers’ adjustment in options prices.
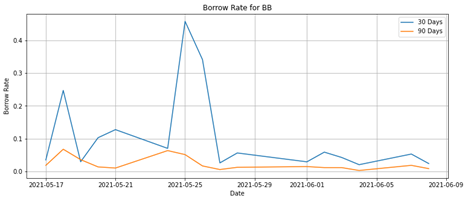
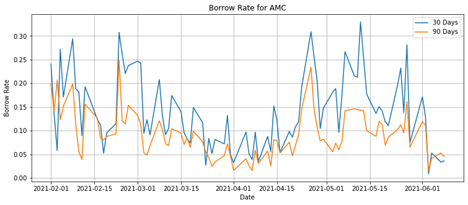
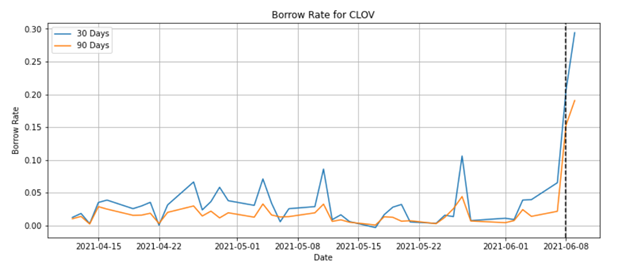
This notion is supported by data on borrow rates of other popular meme stocks such as Blackberry (BB), AMC Entertainment (AMC), and, most recently, Clover Health (CLOV), as shown respectively in the tables below.
As demonstrated in the charts above, meme stocks have become much cheaper to short. The stabilization of borrow rates supports the thesis that short squeezes have become less of a factor in meme stock rallies during June. This is a consequence of market adjustment—options dealers have become better at identifying retail behavior and pricing options accordingly.
Our research has identified two consistent themes regarding borrow rates and retail behavior.
- Spikes in borrow rate are typically accompanied by extremely high risk and subsequent crashes. This is apparent in GME following recent highs of $483 in late January and can be found in several prior AMC price cycles as well.
- Spikes in borrow rate can result in extreme overpricing of options, especially in the out-of-the-money call space. As just one example, AMC implied volatility levels have exceeded over 300% several times, including on June 14, 2021. For reference, this means a $50 AMC stock is expected to range between $7 and $97 with 63% probability over the next month. Exorbitant prices such as these are reflective of what retail traders have become willing to pay for “lotto ticket” bets that have extremely low likelihood of profitability.
With more retail investors looking to meme stocks, social media, and options, institutional investors are also looking to assess the next opportunities and risks.
Garrett DeSimone, PhD is Head of Quantitative Research and Abhinav Gupta is a Quantitative Researcher at OptionMetrics, LLC. Their company is options database and analytics provider for institutional and retail investors and academic researchers that has covered every US strike and expiration option on over 10,000 underlying stocks and indices since 1996.


