

The stock market appeared vulnerable to a pullback to start the week based on poor market internals, states Bonnie Gortler of bonniegortler.com.
However, buyers stepped in quickly, shifted from the defensive to more aggressive sectors, propelling the Nasdaq and S&P 500 (SPX) to record highs. The Russell 2000 surged Friday, leading the broad market higher, giving optimism to the bulls.
Seven of the 11 S&P sectors finished higher for the week ending 08/20/21. Six stronger than the SPDR S&P 500 ETF Trust (SPY), up +1.55%. Energy (XLE), and Financials (XLF) were the leading sectors, +7.45% and +3.48%, while Consumer Staples (XLP) and Utilities (XLU) lagged down -1.35% and -2.02%.
S&P SPDR Sector ETFs Performance Summary
Week Ending 8/27/21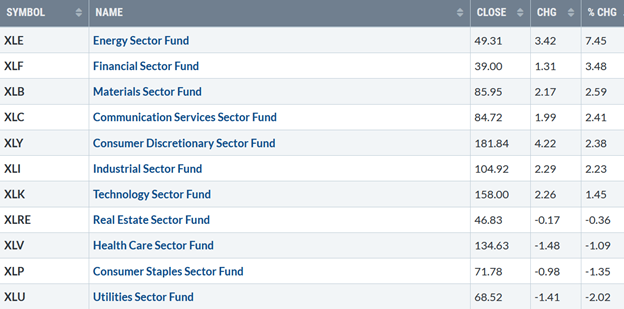
Source: Stockcharts.com
10-Year Treasury yields rose for the week closing at 1.31% (Figure 1), breaking the May downtrend (green line) on Thursday but turned lower on Friday, below resistance at 1.42% (Figure1).
Figure 1: 10-Year Treasury Yields 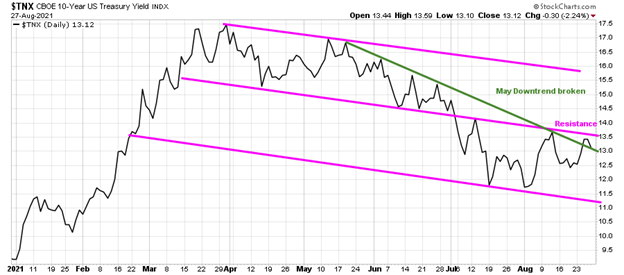
Source: Stockcharts.com
The major averages all finished higher last week. The Dow rose +0.96%, S&P 500 up +1.52%, closing above 4500 for the first time, and Nasdaq climbed +2.82%, a new record high. An impressive week for the Russell 2000 index, up more than three times the S&P 500 gaining 5.05%.
Market breadth has been problematic. However, weekly market breadth improved for both the NYSE and Nasdaq. The New York Stock Exchange Index (NYSE) had 2541 advances and 954 declines. Nasdaq breadth was 3594 advances and 1141declines.
Figure 2: Daily New York Stock Exchange (NYSE) New Lows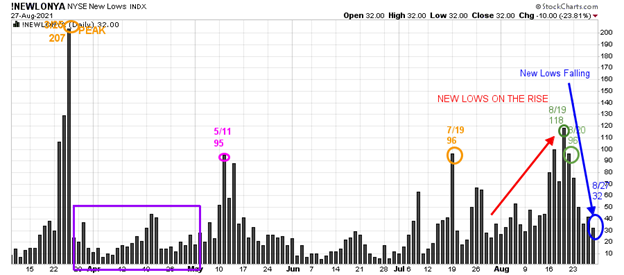
Source: Stockcharts.com
On 3/25/21, the NYSE new lows peaked at 207 (orange circle) and immediately contracted (purple rectangle), followed by a jump to 95 on 5/11, then contracting until 7/19, when they rose to 96 (orange circle). New lows rose to 118 and 96 (green circles) on back-to-back days on 8/19 and 8/20 above the low-risk zone.
Watching new lows on the New York Stock exchange is a simple technical tool that helps awareness about the immediate trend's direction. Learn more in my book, Journey to Wealth. The market is very strong when the new lows are below 25 (very low risk and prices tend to rise). When new lows are between 25 and 50, the risk is low, and prices tend to rise.
Its positive new lows contracted, to close at 32 on 8/27. If new lows stay low, look for the market to continue to trend higher.
“Money will only make you more of what you already are.” — T Harv Eker
Bonnie’s ETFs to Watch Now
Figure 3: Performance week of 8/20/21 – 08/27/21 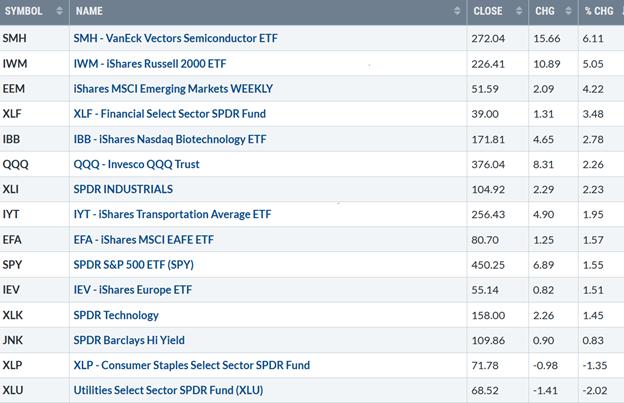
Source: Stockcharts.com
Short-Term Tape Shifts From Negative to Positive
Positives
- Hi-Yield (JNK) and open-end high-yield corporate bond funds rose for the week, now challenging their highs after holding above July lows (Figure 4).
- The Russell 2000 (IWM) led the market higher, closing above 225.00 resistance. MACD gave a repeat buy, showing signs of favorable momentum, and has now broken its June downtrend (Figure 9).
- The weekly relative strength ratio to the S&P 500 (SPY) turned up after a succession of lower lows. (Figure 7).
- After breaking support, the Nasdaq Daily AD Line stopped falling and turned up firmly and is close to breaking the July downtrend (Figure 6).
- Nasdaq had 208 new highs, the highest reading since late June. (Figure 5).
- Semiconductors (SMH) were strong, up 6.11%, outperforming the Nasdaq 100 (QQQ), which gained 2.26%.
- Emerging Markets (EEM) came to life up over 4% for the week and is an attractive speculative buy. A close above 53.05 would clear the 50- and 200-day moving averages.
Negatives
- After breaking the April uptrend, the NYSE A/D line has not yet confirmed the S&P 500 high (Figure 8).
- New highs on the Nasdaq remain below their 2/8/21 new high (Figure 6).
- After the lowest weekly close since October 2020, the weekly Nasdaq Ad-Line remains below the April uptrend (Figure 9), implying the rally may be suspect.
Figure 4: LORD Abbett High Yield Fund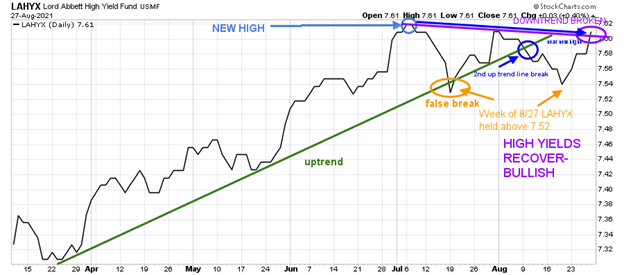
Source: Stockcharts.com
Lord Abbett High Yield, an open-end high-yield corporate bond fund, broke its uptrend in July, but it was a false breakdown. LAHYX then recovered in late July but failed to make a new high, and it declined again, holding the July Low.
High-yield mutual funds and high-yield ETFs such as HYG and JNK reversed, recovering their July losses last week, and now are at or near their all-time highs. Continued strength in high-yields is positive for the broad market. On the other hand, if they stop rising and turn down, taking out the July low, it would signify that trouble lies ahead in the coming weeks to months.
Figure 5: Nasdaq New Highs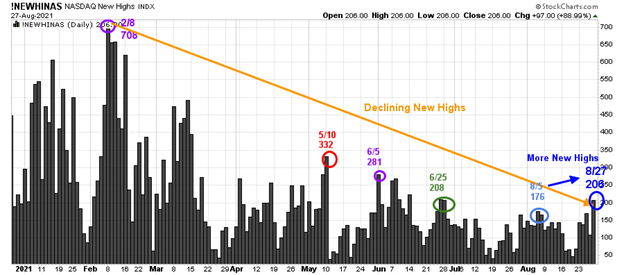
Source: Stockcharts.com
It's positive more Nasdaq stocks made new highs last week, the highest since late June (blue circle). Although the Nasdaq is at an all-time high, new highs remain well below the peak reading of 708 set on 2/8. Watch early this week if new highs continue to expand to over 332, which would be positive for the short term. If they immediately contract, the rally could fizzle quickly.
Figure 6: Daily Nasdaq Advance-Decline Line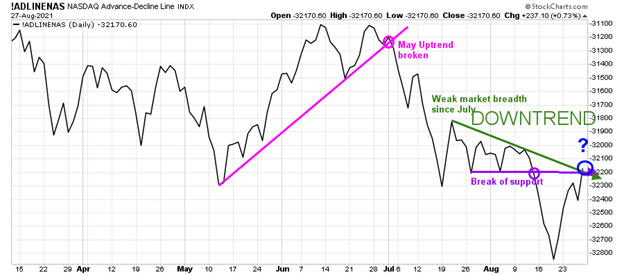
Source: Stockcharts.com
The Daily Nasdaq-line AD-Line broke down in July. The AD-Line improved last week to close near the old support and is in a position to break the July downtrend if there is positive market breadth. Early next week will give a clue if the Nasdaq rally continues or stall. Positive breadth would signify more gains ahead, while negative breadth would signify the Nasdaq could pull back.
Figure 7: Weekly Nasdaq Advance-Decline Line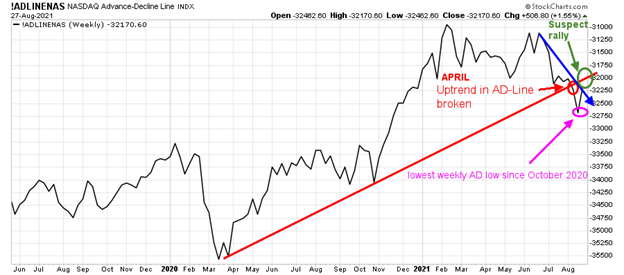
Source: Stockcharts.com
The Nasdaq-line AD-Line had closed at its lowest low since October 2020 before last week's rise. Overhead resistance is above. Consider the rally in Nasdaq suspect until it closes above where it broke down in July (green circle).
Figure 8: New York Stock Exchange Advance-Decline Line Top and S&P 500 Index Bottom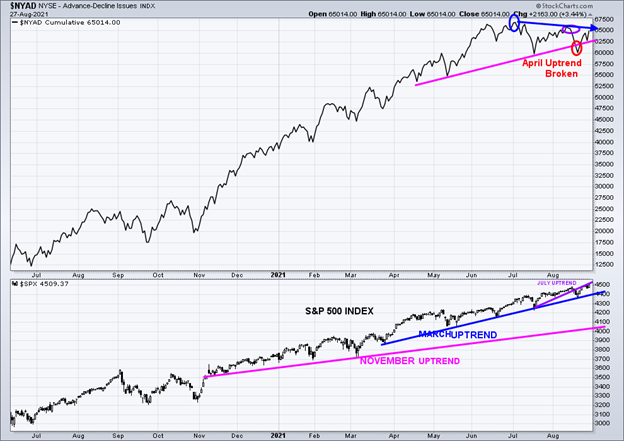
Source: Stockcharts.com
In the top portion of the chart (Figure: 9), the NYSE A/D line broke the April uptrend after failing to make a new high (blue arrow), confirming the S&P 500 high.
The lower chart is the S&P 500 Index in an uptrend from March (blue line), closing at 4509.37. The July uptrend broke (purple line). A short-lived decline followed (red circle), holding above the March uptrend (blue).
A close below 4367.00 would break the March uptrend and likely to trip sell stops on the S&P 500 toward 4250.00 or potentially lower. For now, the bulls get the benefit of the doubt.
Figure 9: Daily iShares Russell 2000 (IWM) Price (Top) and 12-26-9 MACD (Bottom) 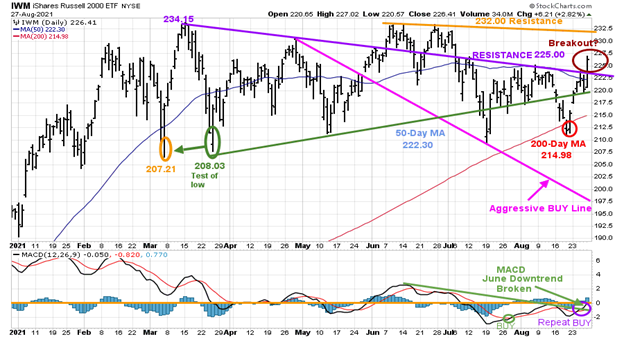
Source: Stockcharts.com
The top portion of the chart is the daily iShares Russell 2000 Index ETF, the benchmark for small-cap stocks, with a 50-day moving average (MA) (blue line) and 200-day moving average (MA), that traders watch and use to define trends.
IWM made a low on 3/5 at 207.21 (orange circle), then peaked at 234.15, followed by a decline to 208.03, successfully testing the March low. In June, IWM, after successive attempts to make a new high failed near 232.00 and turned lower. In July, it held the March low and remained above the 200-Day MA.
August IWM has been lagging the major averages and trading the 200-day MA. However, IWM was strong last week, up over 5%, clearing resistance at 225.00 and closing above its 50-day MA, a possible breakout.
A retracement between 222 and 225.00 is possible and still considered positive. A close above 232.00 previous resistance would confirm the breakout. On the other hand, a close below 214.98, the 200-day moving average would imply a failure and risk to 197.50.
The bottom half of the chart is MACD (12, 26, 9), a measure of momentum. After MACD had no sign of strength, MACD gave a repeat buy last week. It’s positive that MACD broke the June downtrend. Day traders watch closely for further strength or if MACD turns down.
Figure 10: Weekly iShares Russell 2000/S&P 500 (IWM/SPY) Relative Strength Ratio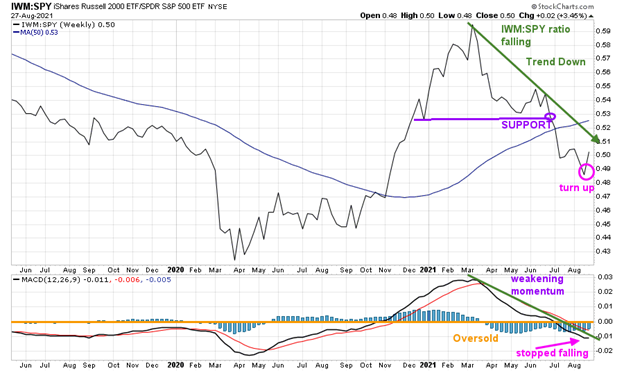
Source: Stockcharts.com
The weekly IWM/SPY ratio fell below support in June (purple line) and was trending lower.
Last week the IWM/SPY ratio turned up but remained below the 50-week moving average (MA), a sign of strength. MACD (in the lower chart) stopped falling to new lows, a positive sign. A turn-up and trend line break would be favorable.
Figure 11: Weekly iShares Russell 2000 (IWM)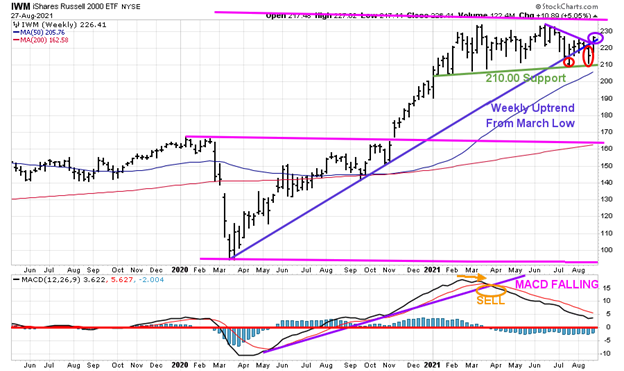
Source: Stockcharts.com
The Russell 2000 (IWM) (top chart) weekly support remains at 210.00. It’s positive IWM broke the weekly June downtrend last week after testing 210.00 support the previous week. On the other hand, a weekly close below 210.00 would be negative.
MACD (lower chart) remains on a sell, not yet oversold, below 0, (red horizontal line) in a favorable buy position. However, it’s a hopeful sign MACD stopped falling. In sum: It’s too early to say that small caps are ready for a sustainable rally for the intermediate-term until IWM closes above resistance at 232.00.
Figure 12: Daily Invesco QQQ Trust Nasdaq (QQQ) Price (Top)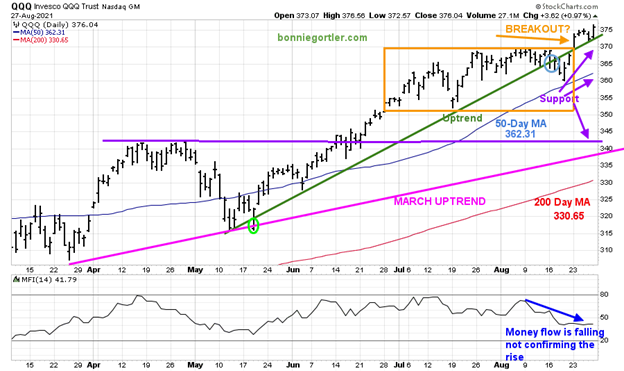
Source: Stockcharts.com
The chart shows the daily Invesco QQQ, an exchange-traded fund based on the Nasdaq 100 Index with its 50-day moving average and 200-day moving average.
The March uptrend remains intact (pink line). Since June, QQQ was in a trading range (orange rectangle) but appeared to have broken out to the upside. The new upside objective is 390.00.
Short-term support is at 370.00, followed by 360.00 and 350.00 at the bottom of the rectangle. It's disturbing Money flow (lower chart) is falling, not confirming the breakout in QQQ.
Any close below the March uptrend would imply a test of the 200-day MA, which stands 330.65 at the time of this writing. As long as QQQ closes above 370.00, the bulls are in control.
Summing Up:
The tape shifted quickly from negative to positive as investors were optimistic after Chairman Jerome Powell of the Federal Reserve spoke on the economic outlook. Market breadth on both the Nasdaq and NYSE improved significantly. The S&P 500 and Nasdaq set record highs. Small caps came to life, a hopeful sign of further gains ahead. Further confirmation is if IWM closes above 232.00. Risk management remains important for the coming months, which tend to be volatile. Review your portfolio and consider lightening up if any of your investments are underperforming, overly exposed in any sector, or not sleeping at night. The bulls are in control for now but know it can quickly change with the bears coming out of hibernation unexpectedly.
Remember to manage your risk, and your wealth will grow.
I would love to hear from you. If you have any questions or comments or would like to talk about the market, email me at Bonnie@Bonniegortler.com.
Disclaimer: Although the information is made with a sincere effort for accuracy, it is not guaranteed that the information provided is a statement of fact. Nor can we guarantee the results of following any of the recommendations made herein. Readers are encouraged to meet with their own advisors to consider the suitability of investments for their own particular situations and for determination of their own risk levels. Past performance does not guarantee any future results.
Learn more about Bonnie Gortler at BonnieGortler.com.


