

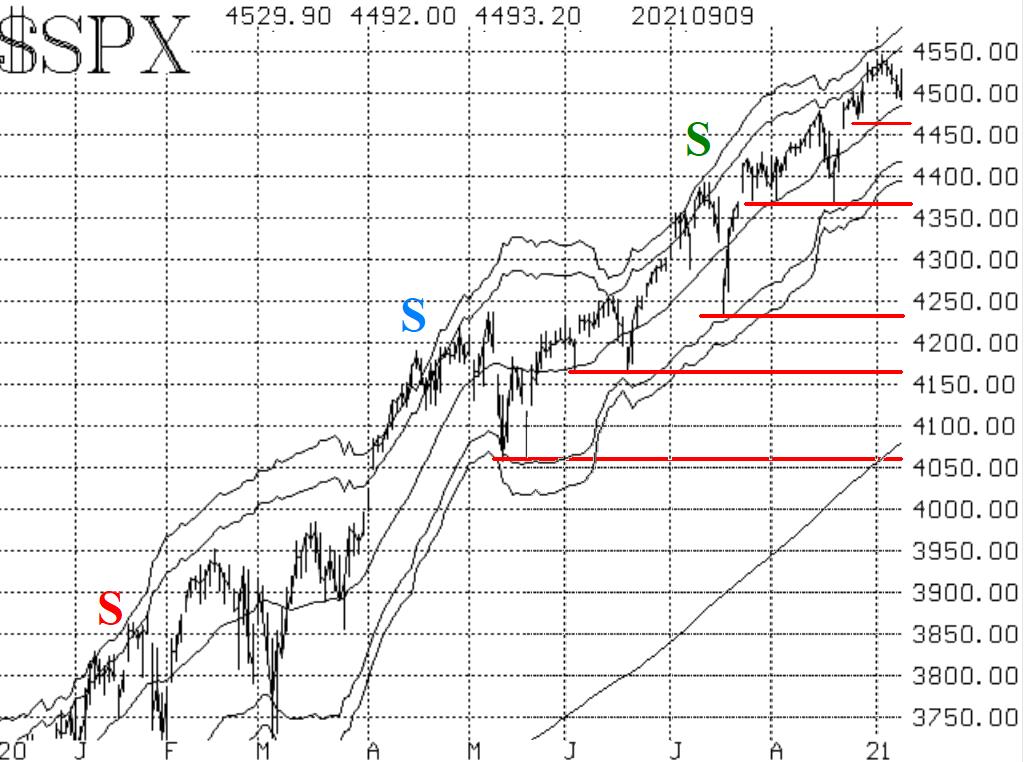
After making a new all-time high on September 2nd, S&P 500 (SPX) has failed to add to the gains, says Larry McMillan of Option Strategist.
Perhaps the sideways movement is all the correction that this market needs, similar to what we saw at the end of July. Regardless, the SPX chart remains bullish in that it is above support and all of its major trendlines are moving higher.
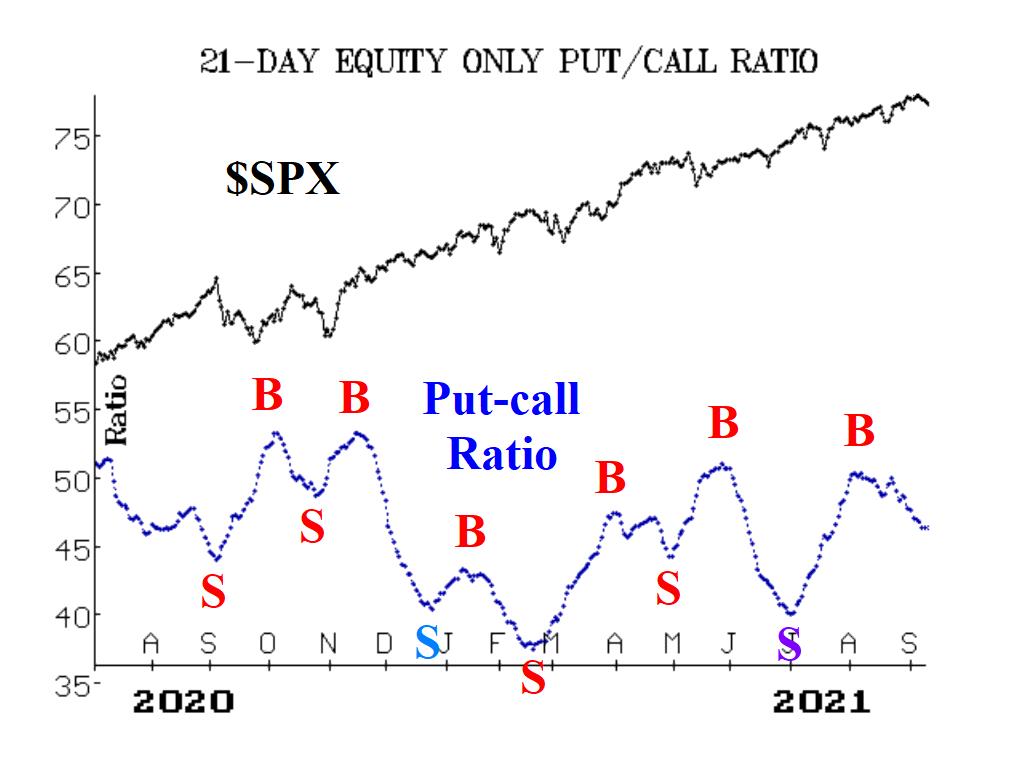
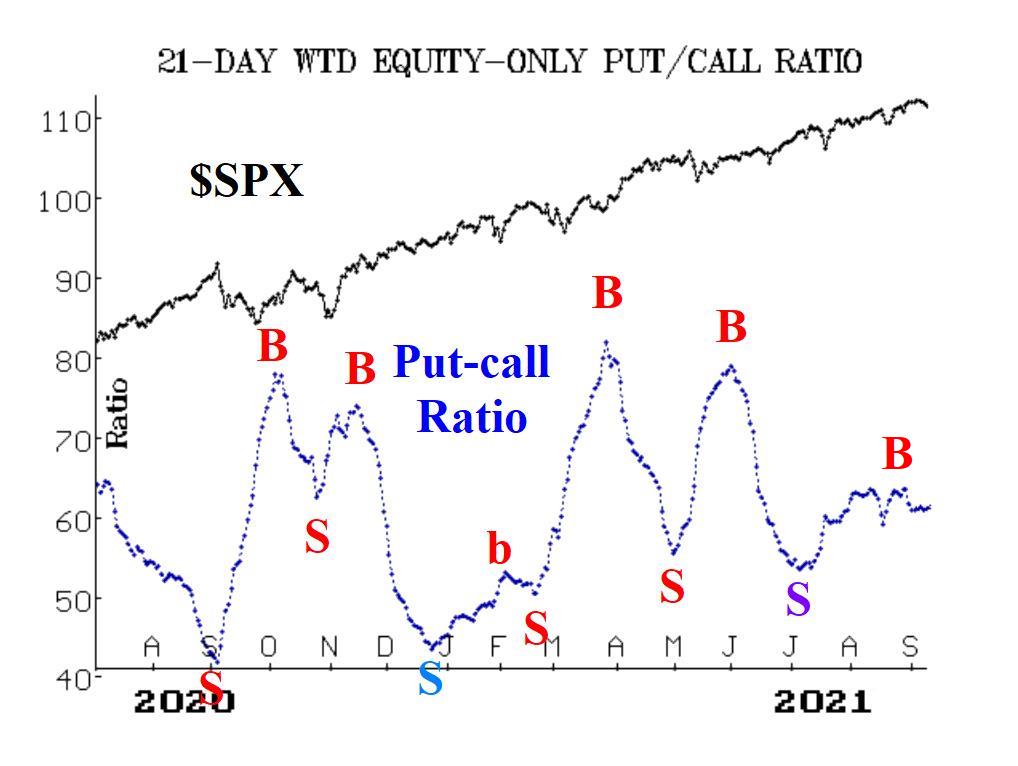
Both equity-only put-call ratio charts are "officially" on buy signals. The standard ratio (Figure 2) turned downward in early August and has been on a buy signal since then. But the weighted ratio has been moving sideways for quite some time, and has only now been given the "buy" status by our computer analysis programs.
Breadth has been -- and continues to be -- a problem. After attempting to show some improvement at the end of August, both breadth oscillators have rolled back over to sell signals this week.
Meanwhile, the indicators related to implied volatility continue to be quite bullish in their outlook for the stock market. The CBOE SPX Volatility Index (VIX) "spike peak" buy signal is still in place, despite a slight rise in VIX this week as the stock market pulled back a little.
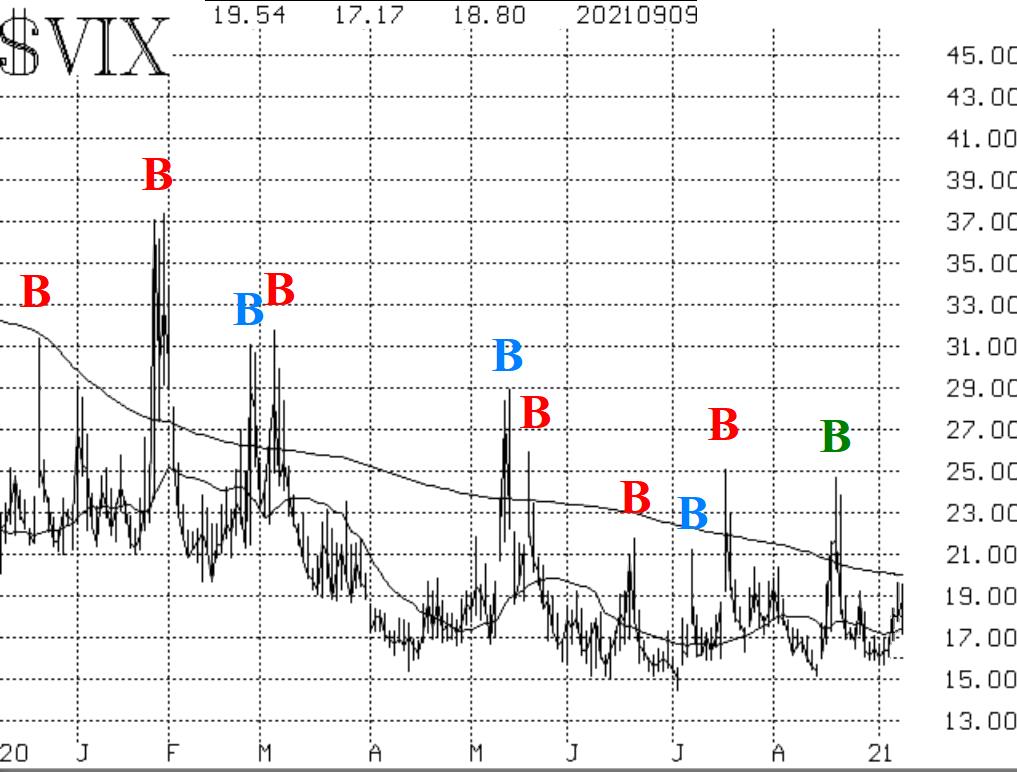
As for the trend of VIX, it remains downward, in that the 20- day Moving Average of VIX and VIX itself are both still below the declining 200-day MA.
So, despite some hesitation this week by SPX, we remain bullish -- but not complacent. The SPX chart has an upward trend, and that is the most important thing.


