

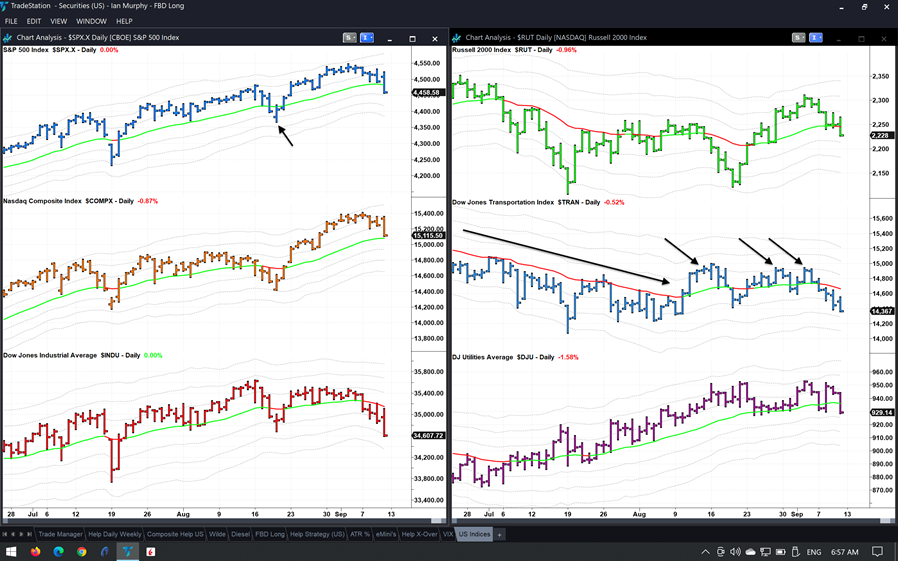
US equity markets pulled back on Friday and are starting to test levels which previously held as support, states Ian Murphy of MurphyTrading.com.
Looking at daily charts of the six indices I use to track the market, the S&P 500 (SPX) (top left) closed just above the -1ATR line, an area which acted as support last month (arrow). The tech heavy NASDAQ settled on the moving average line, but the Dow Jones closed lowest of the three.
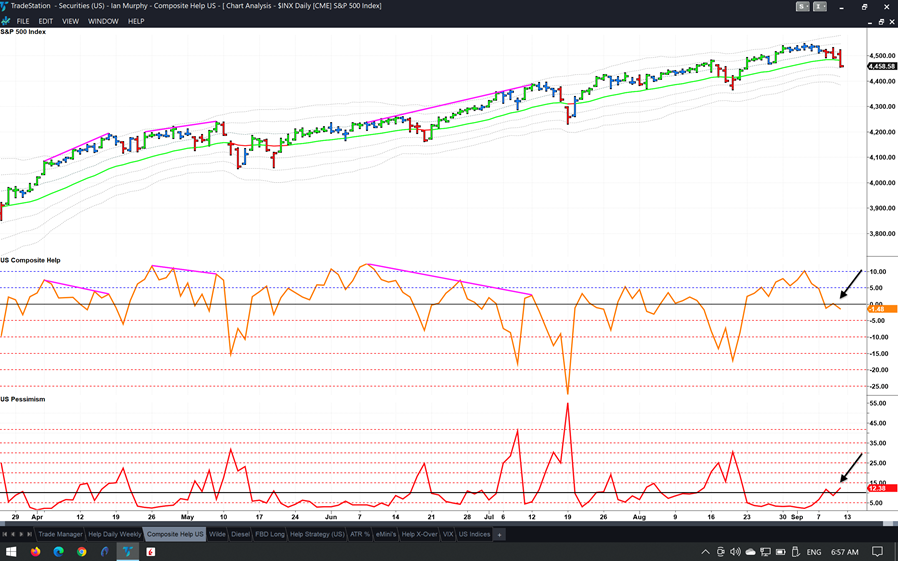
As for market internals, the Composite Help indicator fell below zero in Friday’s session and only the yearly new highs and lows are still positive among the three lookback windows used to calculate this indicator. Pessimism also crossed above the threshold level of 10% as stocks pulled back and started making new 20-day lows.
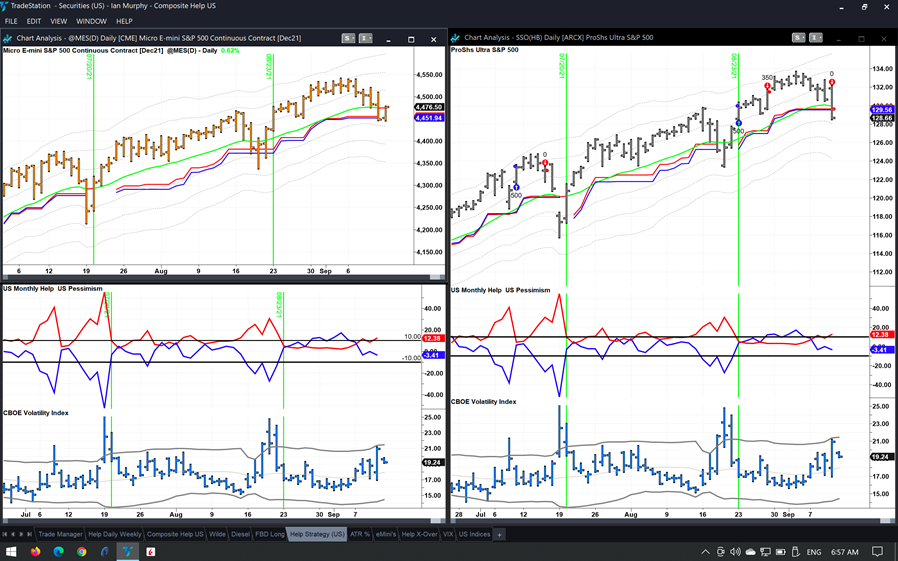
In terms of trading the market, both positions in the Help strategy were stopped out when they pierced their respective trailing stops as shown above. This strategy is a pure play on large cap US equities, so the stops being hit is not surprising, but it is another sign of change taking place under the surface.
Be careful in the week ahead and confirm stop loss orders are in place.
Learn more about Ian Murphy at MurphyTrading.com.


