

Investors shifted from buyers to sellers after returning from the Labor Day holiday, states Bonnie Gortler of bonniegortler.com.
All eleven S&P sectors finished lower the week ending 09/10/21. Six sectors lost less than the SPDR S&P 500 ETF Trust (SPY), down -1.66%. Real Estate (XLRE) was the worst sector giving back almost all its previous week's gains down -3.82%, while HealthCare (XLV) was down -2.67%. Consumer Discretionary (XLY) was the best, only giving up -0.31%.
S&P SPDR Sector ETFs Performance Summary
Week Ending 9/10/21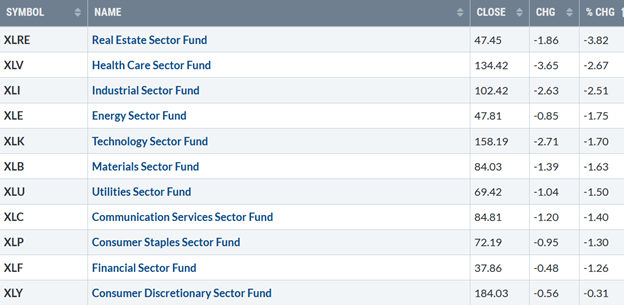
Source: Stockcharts.com
The Dow fell -2.15% for the week, the most significant weekly loss since June. The S&P 500 was down -1.69%, and Nasdaq -1.61%. After consolidating its recent week's gains and failing to get through overhead resistance, the Russell 2000 index was the weakest, falling -2.65%.
Market breadth deteriorated for both the NYSE and Nasdaq and is worrisome. The New York Stock Exchange Index (NYSE) had 983 advances and 2491 declines. Nasdaq had 1463 advances and 3267 declines.
Figure 1: 10-Year Treasury Yields 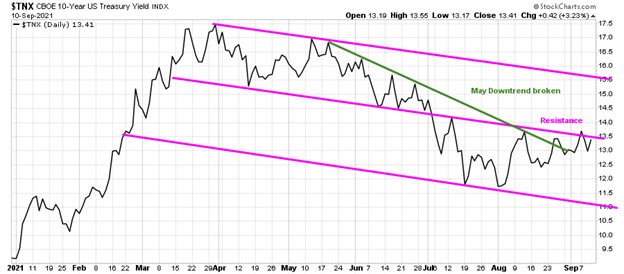
Source: Stockcharts.com
10-Year Treasury yields rose, closing at 1.341% last week, below mid-August resistance, and below the July high of 1.42% (Figure 1).
A close above 1.42% implies yields to test 1.55%. With most expecting rates to rise, it would not surprise me if rates fell in the near term toward the August lows.
Figure 2: Daily New York Stock Exchange (NYSE) New Lows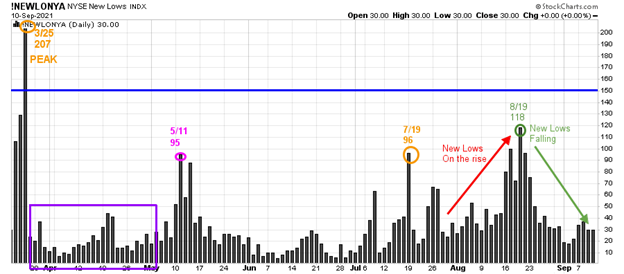
Source: Stockcharts.com
On 3/25/21, the NYSE New Lows peaked at 207 (orange circle) and immediately contracted (purple rectangle), followed by a jump to 95 on 5/11. New lows then contracted from May to 7/19, before rising to 96 (orange circle), peaking at 118 (green circle) on 8/19, then declined.
Watching New lows on the New York Stock exchange is a simple technical tool that helps awareness about the immediate trend's direction. Learn more in my book, Journey to Wealth. The market is very strong when the New Lows are below 25 (Very Low Risk, and prices tend to rise). When New Lows are between 25 and 50, the risk is low, and prices tend to rise.
New lows closed on 9/10 at 30, only slightly increased from the previous week, favoring a bullish bias until new lows rise and close above 150 (blue line).
“I have about concluded that wealth is a state of mind, and that anyone can acquire a wealthy state of mind by thinking rich thoughts.” —Edward Young”
Bonnie’s ETFs to Watch Now
Figure 3: Performance week of 9/03/21 – 09/10/21 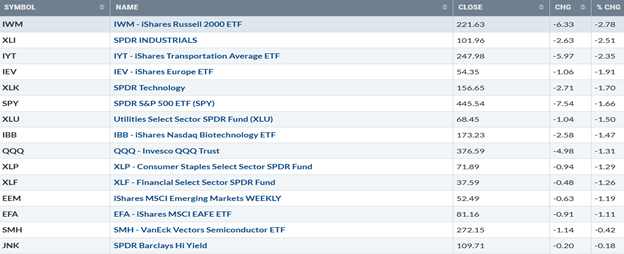
Source: Stockcharts.com
Positives
- Hi-Yield (JNK) and open-end high yield corporate bond funds closed flat last week at or near new highs (Figure 4).
- The Russell 2000 (IWM) fell more than the major averages closing below 225.00 support. MACD generated a new sell (Figure 9).
- Semiconductors (SMH) fell only -0.42% for the week, stronger than QQQ.
- The weekly relative strength ratio to the S&P 500 (IWM/SPY) remains above the July low (Figure 10).
Negatives
- Transports (IYT) have been in a downtrend since May and this week broke the short-term July uptrend (Figure 8).
- The Nasdaq Daily AD Line broke the August uptrend failing to get through the August high and turned lower (Figure 6).
- The Nasdaq-line weekly AD-Line remains below where it broke down in July (Figure 7).
- September and October are volatile months, and historically when some of the worst bear markets have occurred.
- The Financial Sector (XLF) technicals continue to weaken, closing at their lows, warning of an impending decline (Figure 13).
- Apple (AAPL) fell -3.31% Friday after a ruling Apple must allow external payment links. In addition, short-term chart patterns imply the decline may not be over.
- Risk is increasing. CBOE Volatility (VIX) is on the rise closing at 20.95. its highest level since 8/18 when it closed at 21.24. Further downside weakness would imply a test of 29.00 and potentially higher.
Figure 4: LORD Abbett High Yield Fund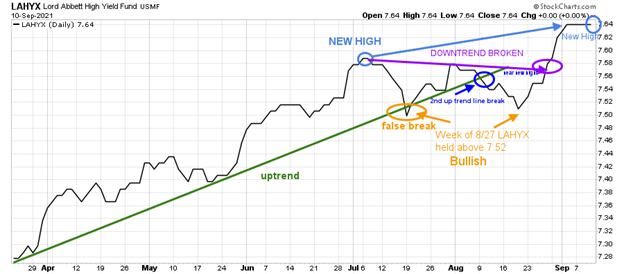
Source: Stockcharts.com
Lord Abbett High Yield, an open-end high yield corporate bond fund, broke its uptrend in July, a false breakdown, and then recovered to make a new high.
Hi Yield mutual funds, and Hi Yield ETFs such as HYG and JNK closed at or near all-time highs despite the decline in U.S. Equities. Continued strength in Hi Yields is positive for the broad market.
However, if they begin to fall now and take out the July low, it would signify that trouble lies ahead.
Figure 5: Nasdaq New Highs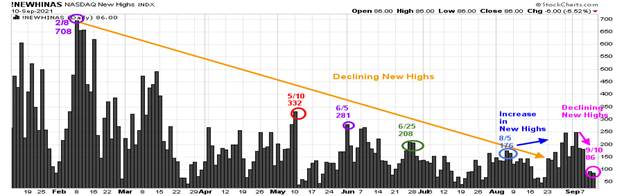
Source: Stockcharts.com
Although the Nasdaq is near all-time highs, New Highs remain well below the peak reading of 708 set on 2/8, closing at a paltry 86 as of 9/10.
Watch if New Highs begin to expand over 250 and then close above the 5/10 high of 332. It will be favorable if new highs increase for the short term. For now, the contraction of new lows is a warning more weakness is likely.
Figure 6: Daily Nasdaq Advance-Decline Line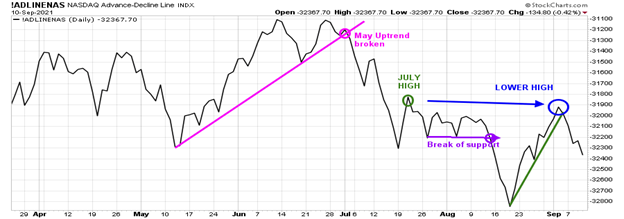
Source: Stockcharts.com
The Daily Nasdaq-line AD-Line broke down in July, improved in August but failed to take out the July high.
Continued negative breadth breaking the August low would be negative.
On the other hand, positive breadth above the July high would be an encouraging sign of higher prices.
Figure 7: Weekly Nasdaq Advance-Decline Line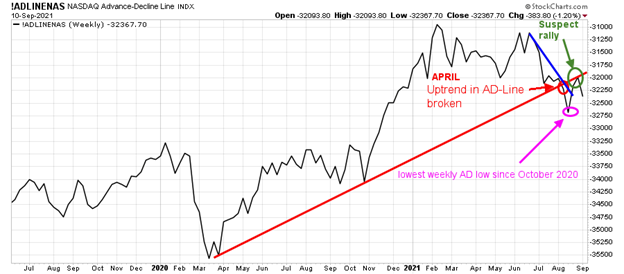
Source: Stockcharts.com
The Nasdaq-line AD-Line in August closed at its lowest low since October 2020.
As mentioned in the 09/03 Wealth Update, the improvement in the AD Line stopped at resistance, a suspect rally failing to get above the uptrend line (red line) where it broke down in July (green circle).
Further weakness in Nasdaq is likely unless market breadth improves.
Figure 8: Transportation Average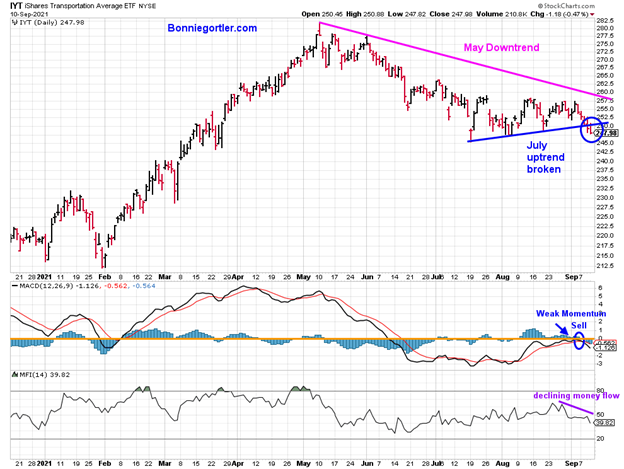
Source: Stockcharts.com
Transports have continued to lag and remain in a downtrend since May. MACD is on a sell and money flow is declining. Short term objective is between 235.00 and 237.00.
Figure 9: Daily iShares Russell 2000 (IWM) Price (Top) and 12-26-9 MACD (Bottom)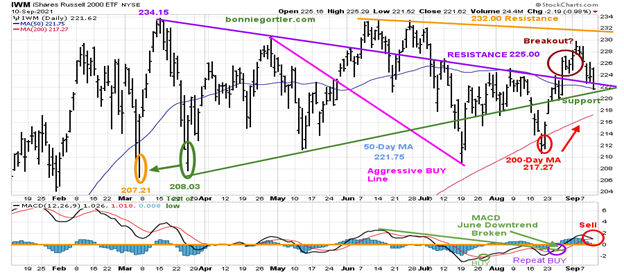
Source: Stockcharts.com
The top portion of the chart is the daily iShares Russell 2000 Index ETF (IWM), the benchmark for small-cap stocks, with a 50-Day Moving Average (MA) (blue line) and 200-Day Moving Average (MA), that traders watch and use to define trends.
IWM made a low on 3/5 at 207.21 (orange circle), then peaked at 234.15, followed by a decline to 208.03, successfully testing the March low. In June and July, IWM, after successive attempts to make a new high failed near 232.00 and turned lower but did not take out the March low.
In early August, IWM had lagged the major averages. However, IWM came to life at the end of the month, clearing resistance at 225.00 and closing above its 50-Day MA, appearing to be a breakout as mentioned in the 09/03 Market Wealth Update. However, IWM never closed above resistance at 232.00 and turned down.
The bottom half of the chart is MACD (12, 26, 9), a measure of momentum. MACD generated a sell after recently breaking the June downtrend. There is a high probability 207.21 will be tested again.
IWM holds closed at 221.62, a critical support area. Only a few points separate the 50-Day MA and the 200-Day MA. A close below 217.27, the 200-Day Moving Average, would confirm the breakout failed and a potential decline to 198.00.
Figure 10: Weekly iShares Russell 2000/S&P 500 (IWM/SPY) Relative Strength Ratio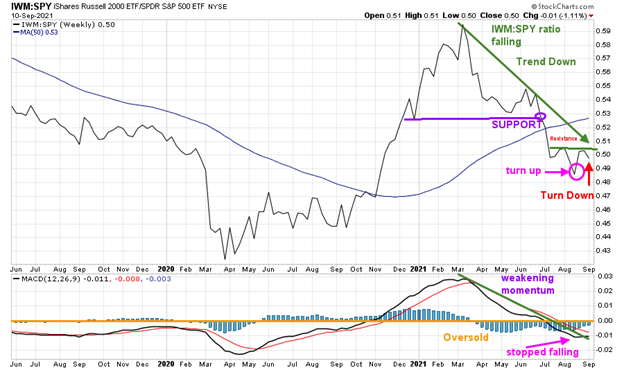
Source: Stockcharts.com
The weekly IWM/SPY ratio fell below support in June (purple line).
With the late August gains in IWM, the IWM/SPY ratio turned up. However, it failed to get through the July resistance and the July downtrend.
MACD (in the lower chart) stopped falling. Wait for a turn up above resistance for confirmation the decline is over, and the advance will resume.
Figure 11: Weekly iShares Russell 2000 (IWM)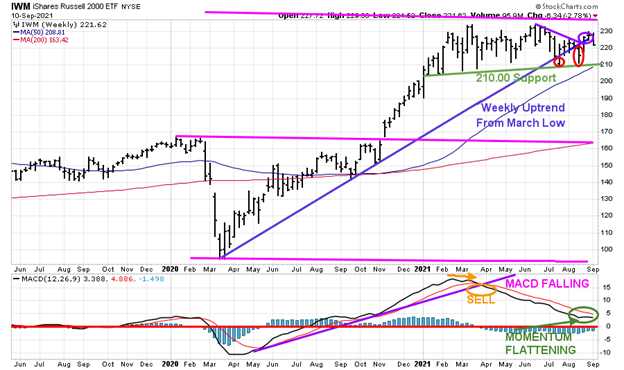
Source: Stockcharts.com
The Russell 2000 (top chart) weekly support remains at 210.00. Resistance is at 232.00. A close below 210.00 would give a downside objective to 198.00 followed by 186.00.
MACD (lower chart) remains on a sell. MACD is not yet oversold, below 0, (red horizontal line) in a favorable buy position.
Figure 12: Daily Invesco QQQ Trust Nasdaq (QQQ) Price (Top) Money Flow (Bottom)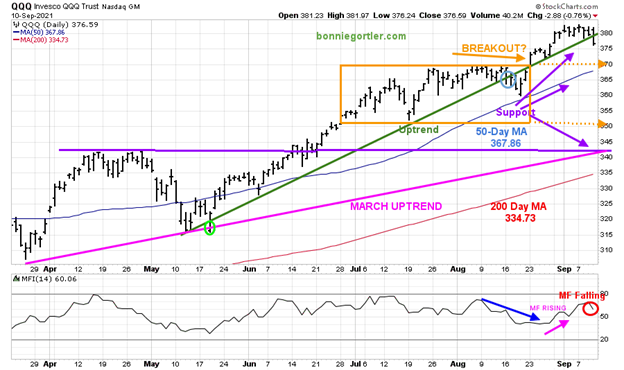
Source: Stockcharts.com
The chart shows the daily Invesco QQQ, an exchange-traded fund based on the Nasdaq 100 Index with its 50-Day Moving Average and 200-Day Moving Average.
The March uptrend (top chart) remains intact (pink line). Since June, QQQ was in a trading range (orange rectangle) and then broke out to the upside in August. The upside objective remains at 390.00. QQQ fell below the first support at 375.00 on Friday.
The next level of support is 370.00, where the QQQ broke out. A close below 370.00 would imply a test of 350.00 followed by 340.00, where significant support lies.
Notice the shift in money flow (lower chart) from rising to falling, no longer supporting a rise in QQQ (red circle). Any close below the March uptrend would likely hit sell stops to test the 200-day MA, which stands at 334.73 at this writing.
I am not optimistic 370.00 will hold. However, as long as QQQ closes above 370.00, give the benefit of the doubt to the bulls.
Caution in the Financial Sector - A potential shift in trend
Figure 13: Weekly Financial Select Sector SPDR (XLF) Price (Top), XLF/S&P 500 (XLF/SPY) Relative Strength Ratio (Middle) and Weekly 12-26-9 MACD (Bottom)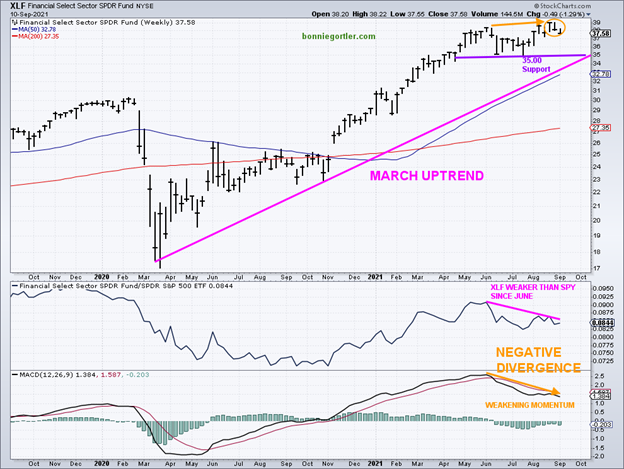
Source: Stockcharts.com
The latest technical action in Financials is worrisome and bears watching. XLF (top chart) closed at its low for the second week in a row (orange circle).
In the middle chart, the Financial Sector remains weaker than the S&P 500.
Notice how MACD momentum is weakening in the lower chart, forming a negative divergence, implying a potential trend shift in trend will occur. A negative or bearish divergence forms when the price makes higher highs, and MACD makes a lower high.
Financials have been leaders of the advance, but there is an increased risk of their leadership coming to an end.
Summing Up:
Bears came out of hibernation. The Dow, S&P 500, and Nasdaq were all down last week, turning the tape negative. However, it was an orderly decline with no panic amongst traders. Market breadth deteriorated. Day-to-day volatility is on the rise, which increases risk in the near term. However, key support levels remain intact for now. Caution is advised early in the week to see if the weakness continues, implying further downside that could accelerate quickly or if the averages stabilize and turn up.
Remember to manage your risk, and your wealth will grow.
I would love to hear from you. If you have any questions or comments or would like to talk about the market, email me at Bonnie@Bonniegortler.com
Disclaimer: Although the information is made with a sincere effort for accuracy, it is not guaranteed that the information provided is a statement of fact. Nor can we guarantee the results of following any of the recommendations made herein. Readers are encouraged to meet with their own advisors to consider the suitability of investments for their own particular situations and for determination of their own risk levels. Past performance does not guarantee any future results.
Learn more about Bonnie Gortler at BonnieGortler.com.


