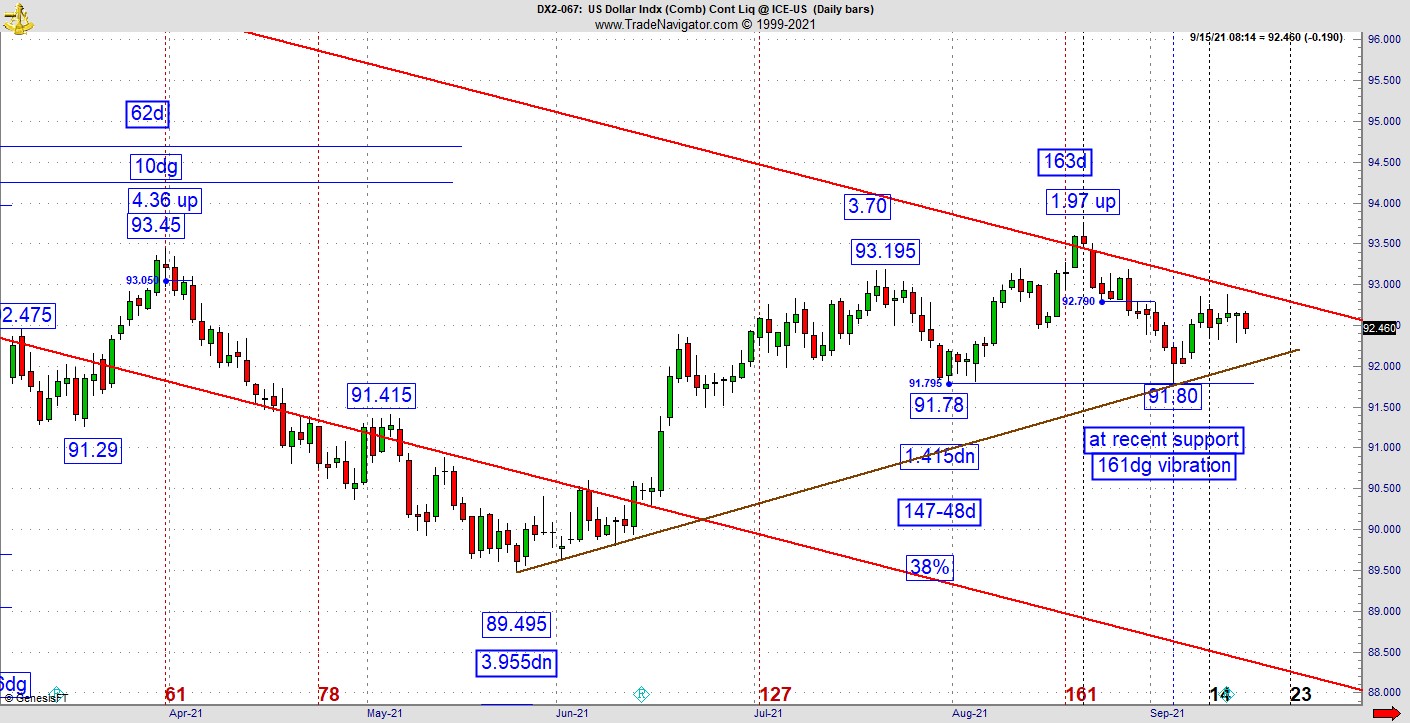
Last week I described for you a US dollar pattern stuck between two key golden spiral markings, explains Jeff Greenblatt of Lucas Wave International.
On the one hand we have our high with its 62/163-day peak. From there it dropped for two weeks only to find a landing spot on the 161dg vibrational day on the Gann calendar. The higher probability was for both sides to slug it out just like the Yanks and Mets did this weekend. While the Mets were the near-term winners on the 20th anniversary commemoration, the greenback stayed the best show about nothing since Seinfeld reruns.

Don’t kid yourself, it’s not going to stay this way. As we look to the chart, it remains wedged above the near-term trend line and the much larger descending bear channel. Within the week we’ll have the seasonal change point and a new Fed meeting. Ever notice how Fed meetings fall out right at the change of season? That can’t be a coincidence. There will be another wild card working in a few days. It was announced last week the Chinese behemoth Evergrande is planning to suspend interest payments on loans from two banks on the 20th. Negotiations for an extension remain underway. Various sources in my inbox have been complaining about the lack of action in the stock market lately.
Don’t worry, the sleeping giant is about to wake up. One doesn’t want to poke the bear. First of all, at the rate the greenback is going, it’s going to be forced out of its wedge one way or the other. At this point the tight consolidation looks a little more bullish than bearish but conditions can change very quickly as it gets closer to the goal line. It will be there by the Fed/seasonal change point event.

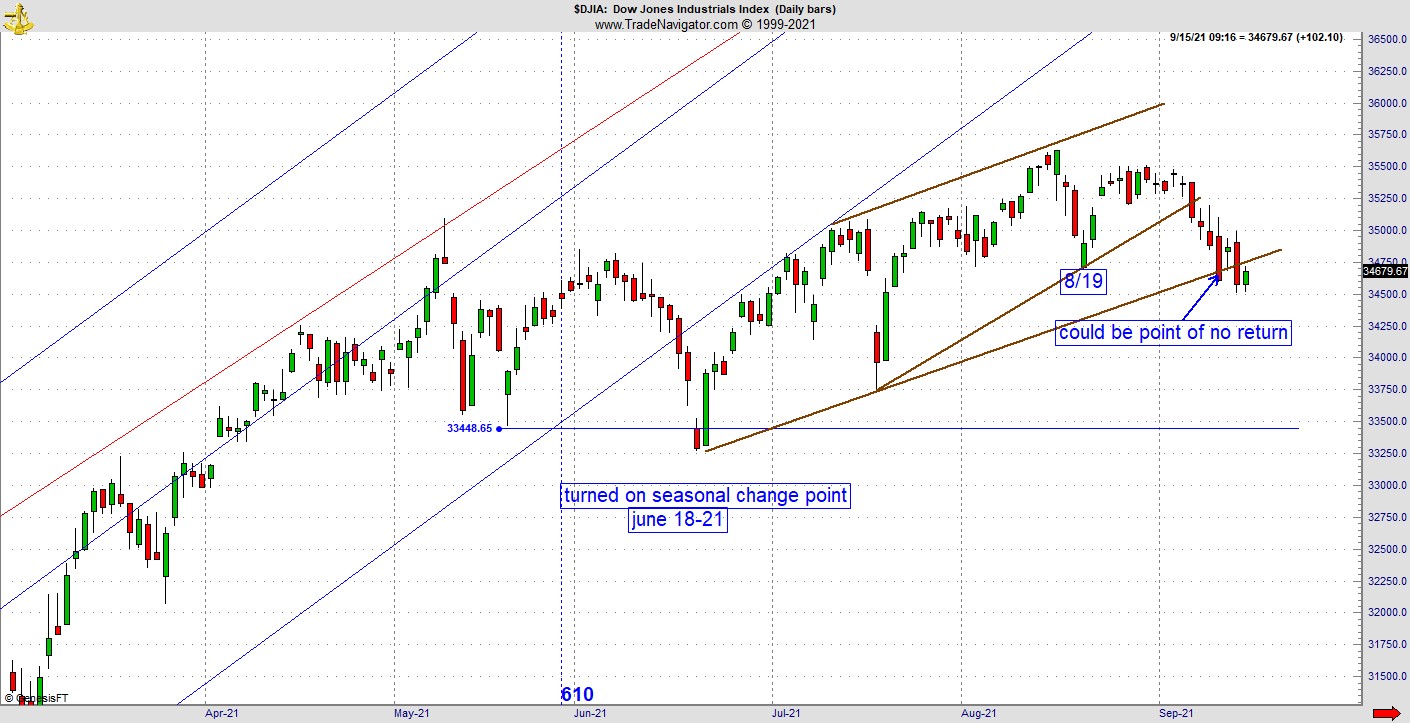
The Dow has a similar dilemma. There are a couple near-to-intermediate-term trend lines that are starting to melt. On this chart we see two support lines, which are trend lines. The first diagonal, which has been breached represented an aggressive bullish stance. If that held the higher probability could’ve been an ending diagonal wedge as it already had two bullish thrusts but the leg, which began on August 19 failed and now it has also breached lower trend line support. If this fails, the next stop is likely the June seasonal change point area, which held the entire summer. But if it gets there, it could be the proverbial snowball getting larger the more it falls down the hill.
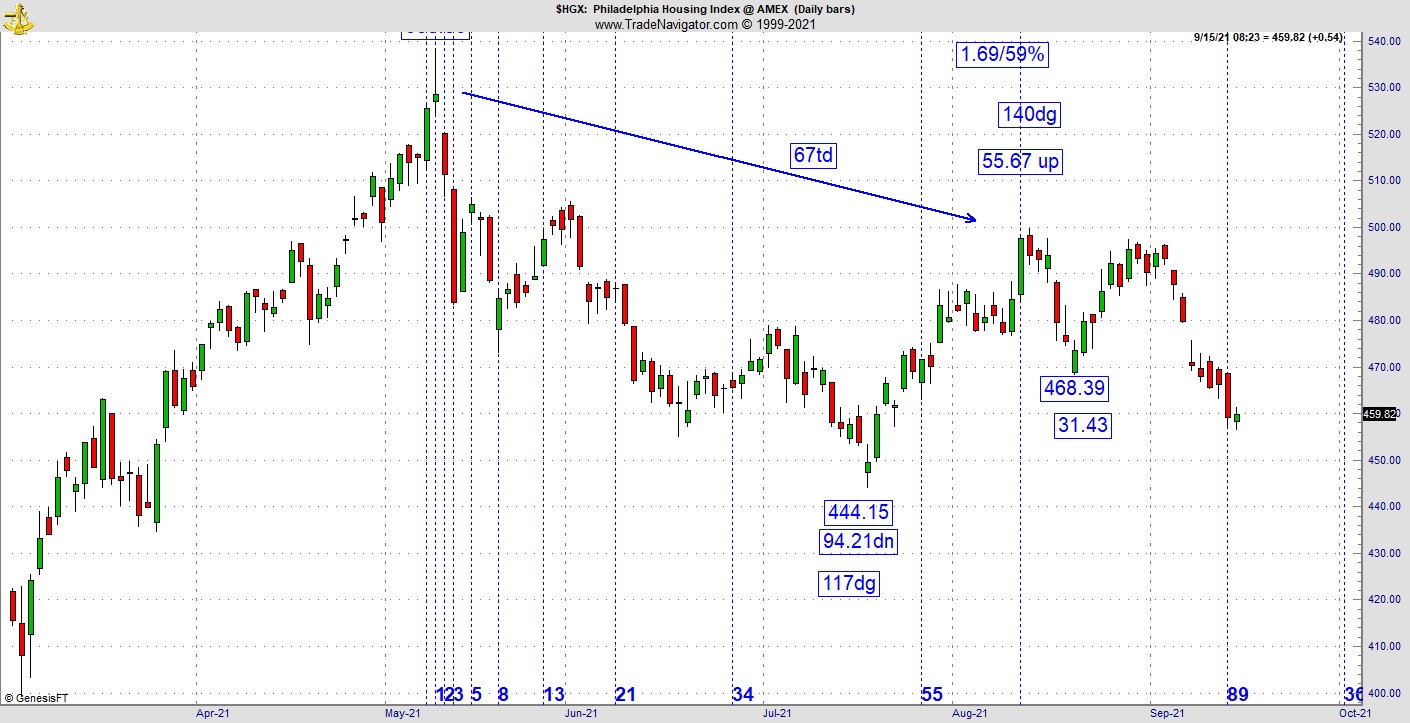
Let’s not forget, this is September. If something is going to happen, this is the time of year for it to happen. We’ve talked about the housing market (HGX). It looks terrible. The Transports are already testing major support at 89 days off the high. Look at the prior low, its 2089.67 points down. At the 89-day mark, this is the kind of replication that could save the pattern. A breach here could go a long way.

I hear all kinds of rumor and innuendo about what is going to happen. What I can tell you is it appears the Fed is the major purchaser of US Treasuries at this point and the rest of the world isn’t an eager buyer anymore. If the greenback were to head south, it could do so in quick fashion because if central banks really decide to dump the dollar, it will be a coordinated effort to do it at the same time. I really don’t want to get into geopolitics too much, but this story went viral quickly, so you already know about it. When the alternate media picked this up, I thought it could stay under the radar. But now even FOX continues to report revelations about the conduct of General Milley, Chairman of the Joint Chiefs of Staff. As it turns out, famed journalist Bob Woodward and national political reporter Robert Costa contend Milley secretly informed China, he would warn them in advance of any attack by US military forces among other things. This has all been confirmed by the Pentagon. It’s now mainstream news.
Why would we be talking about this on the financial page? It’s very simple. Who is going to extend credit to the US under these conditions? The very idea of a fiat currency has to be tied to the confidence the crowd has in it. In recent weeks, that confidence has been eroding by leaps and bounds. Congress faces a couple of key deadlines. They need to pass appropriation bills by September 30 to prevent a government shutdown. Last week Janet Yellen warned the Treasury could run out of cash in October. The Bipartisan Policy Center is pointing to a period from the middle of October thru middle of November as a point Congress must raise the debt ceiling.
It's about to get very interesting. As far as I’m concerned, what materializes on the chart is most important. What I’ve found over the years is if we are going to get important news in any regard, the chart pattern (along with all the cycle and vibration work) usually gives us advance notice of any problem. It can more obvious than other times. Right now, it’s fairly obvious. All the US dollar needs to do is take a right turn at any time going forward. You see the problem spelled out in the Dow. Investors seem to be taking a wait-and-see approach. It’s probably a prudent course of action at this point. But it’s also very likely the ship is about to be steered in an irreversible direction very soon. The tea leaves don’t look very good right now.
For more information about Jeff Greenblatt, visit Lucaswaveinternational.com.


