

The S&P 500 (SPX) broke down on Monday, September 20th, violating several support levels, including the very important one at 4370, says Larry McMillan of Option Strategist.
A gap was left on the chart at 4430. In a truly bearish environment, further selling would have followed. Instead SPX has risen, filled the gap, and closed back above 4430. In addition, several buy signals were registered (although to be fair, there are still some lingering sell signals as well).
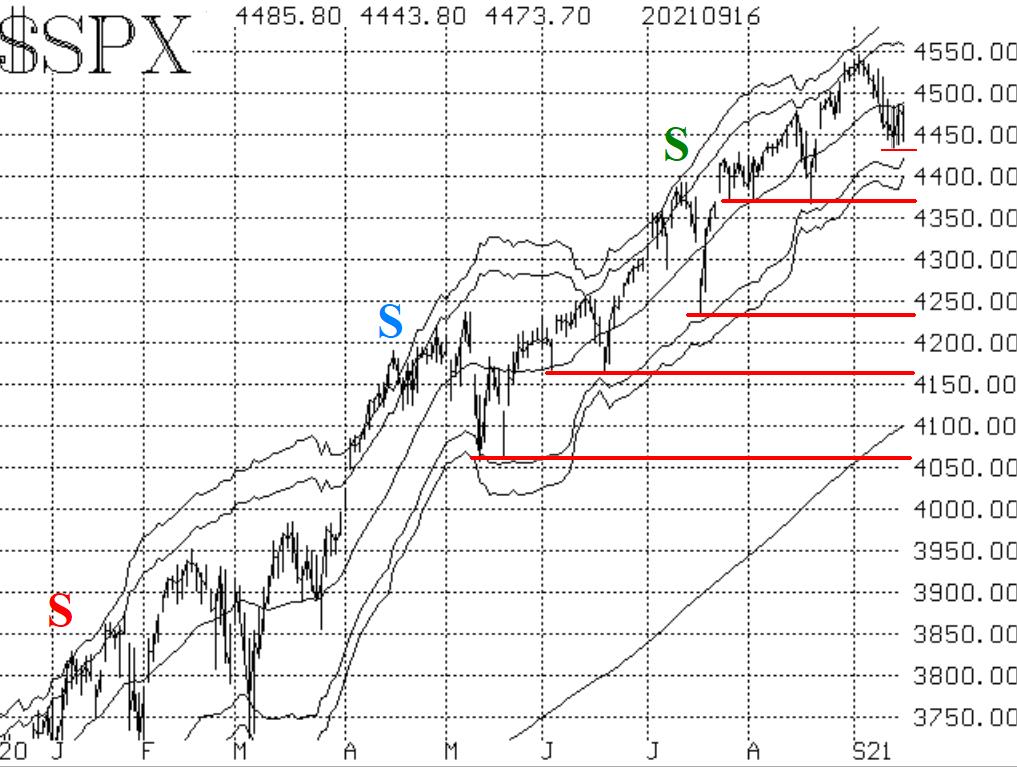
There is now (untested) support at this week's lows, just above 4300. There is technically some resistance up to about 4490, and then there is also resistance at the all-time (September) highs just below 4550.
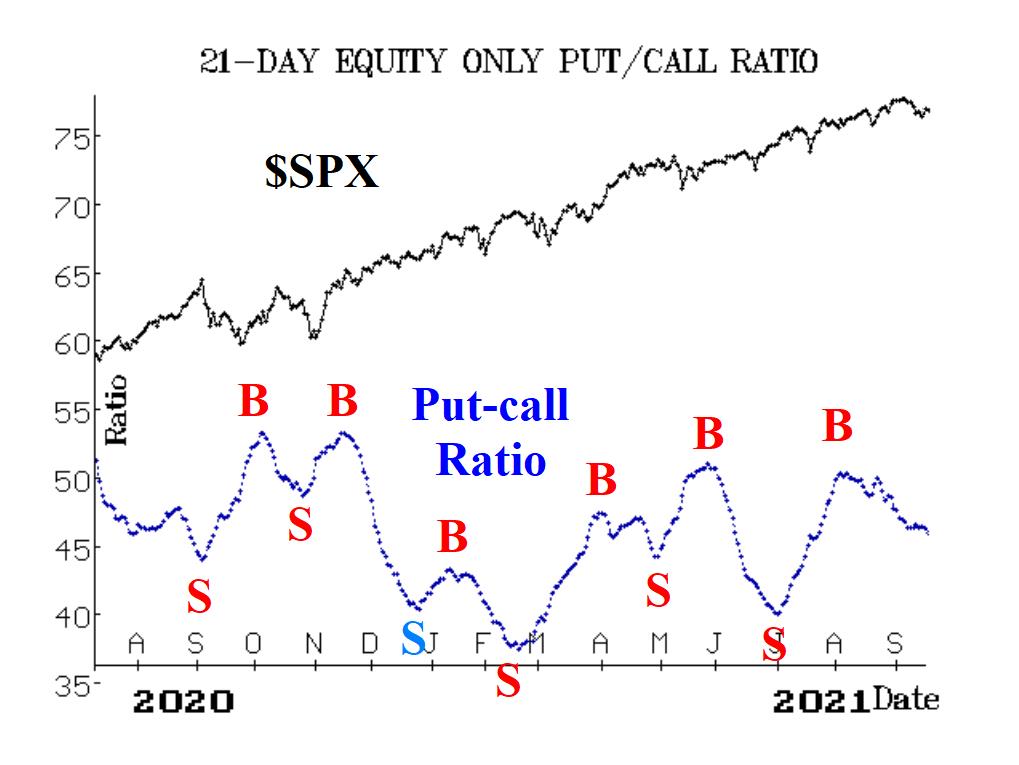
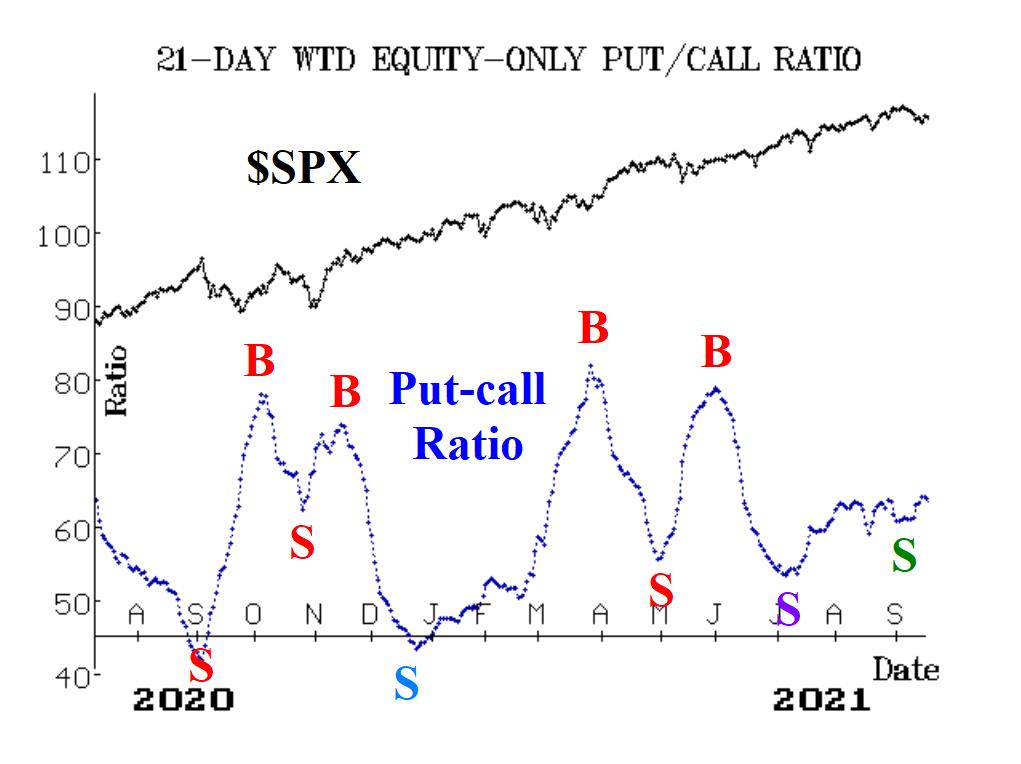
Equity-only put-call ratios remains mixed, with the standard ratio falling (i.e., on a buy signal), and the weighted ratio rising (i.e., on a sell signal).
Breadth was poor on the market decline a week ago, and both breadth oscillators dropped into deeply oversold territory. On the recovery rally this week, breadth has improved, and both breadth oscillators have generated buy signals.
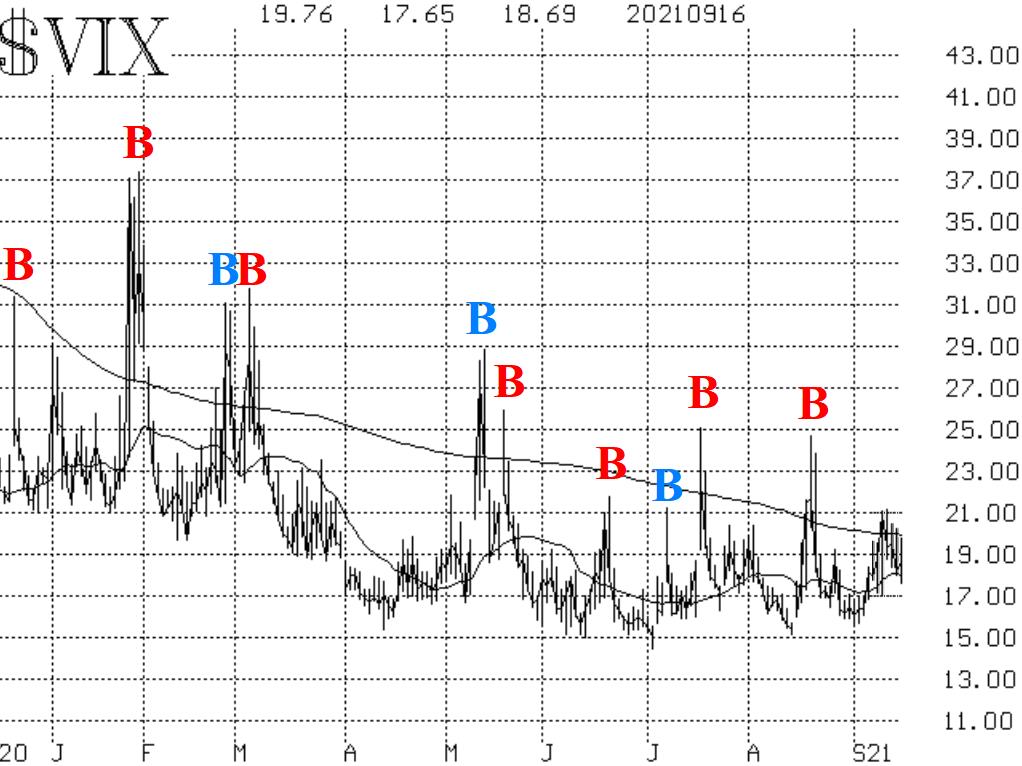
The CBOE SPX Volatility Index (VIX) spiked up and right back down again, generating a new "spike peak" buy signal after just one day in "spiking" mode. This is consistent with most of the "spike peak" buy signals in the last year or so.
In summary, it certainly seems that the bears have lost another chance to take charge. Their last hope seems to lie in the SPX resistance up to the declining 20-day moving average of SPX, at 4490. But the bulls have new-found strength.


