

The bears came out of hiding for a short visit to start the week. Bulls scooped up stocks at discount prices, states Bonnie Gortler of bonniegortler.com.
Six S&P sectors finished higher the week ending 09/17/21. Five sectors gained more than the SPDR S&P 500 ETF Trust (SPY), up +0.57%. Energy (XLE) was on fire, the second week in a row gaining +4.46%. Financials (XLF) were up 2.14% despite bearish technical patterns, came back to life as 10-year yields rose sharply. Utilities (XLU) and Real Estate (XLB) were the weakest, down -1.15% and -1.46%, respectively.
S&P SPDR Sector ETFs Performance Summary
Week Ending 9/24/21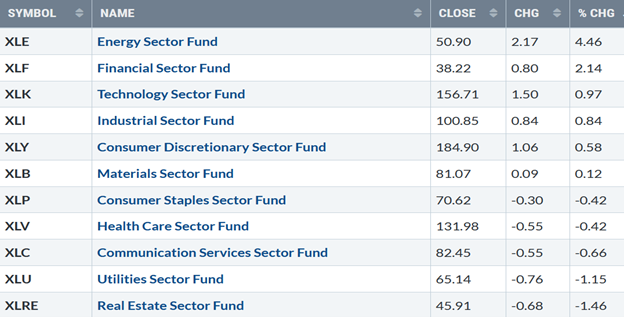
Source: Stockcharts.com
The Dow and Nasdaq had their worst day on 9/20 since May. By Friday’s close, the major averages all recovered, showing gains in a volatile week. The Dow rose +0.62% for the week; the S&P 500 up +0.51%, and Nasdaq +0.02%. The Russell 2000 index gained +0.50%.
Market breadth for both the NYSE and Nasdaq was slightly negative. The New York Stock Exchange Index (NYSE) had 1721 advances and 1762 declines. Nasdaq had 2266 advances and 2496 declines.
Figure 1: 10-Year US Treasury Yields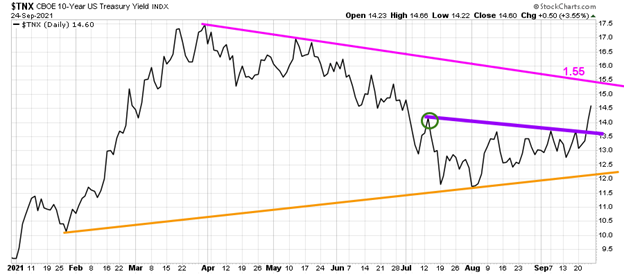
Source: Stockcharts.com
10-year US Treasury yields rose sharply last week, closing above August resistance (purple line) at 1.46% and exceeding the 7/13 high of 1.42% (green circle). A rise to 1.55% (pink line) and potentially toward April’s high is possible (Figure 1).
Figure 2: 5 -Year US Treasury Yields 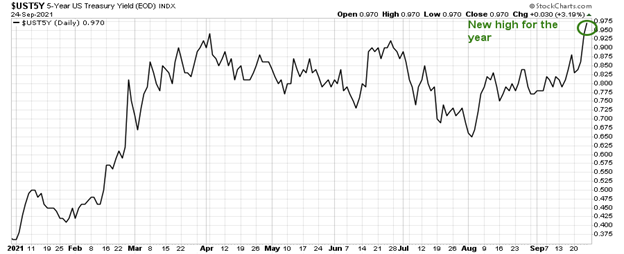
Source: Stockcharts.com
Five-year US Treasury yields trended higher too, closing at 0.97%, a new high for 2021. More signs are materializing of a possible rate hike by year-end or early in 2022.
Figure 3: Daily New York Stock Exchange (NYSE) New Lows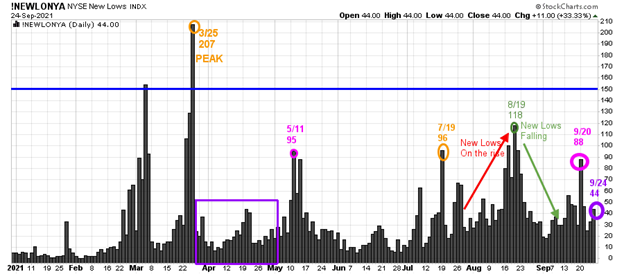
Source: Stockcharts.com
On 3/25/21, the NYSE new lows peaked at 207 (orange circle) and immediately contracted (purple rectangle), followed by a jump to 95 on 5/11. New lows then contracted from May to 7/19, before rising to 96 (orange circle), peaking at 118 (green circle) on 8/19, then declined.
Watching new lows on the New York Stock Exchange is a simple technical tool that helps awareness about the immediate trend's direction. Learn more tips in my book, Journey to Wealth. The market is very strong when the new lows are below 25 (very low risk and prices tend to rise). When new lows are between 25 and 50, the risk is low, and prices tend to rise.
Despite the sell-off on 9/20, new lows only rose to 88 on 9/20 before contracting and closing at 44 on 9/24.
A significant correction is not likely until new lows rise and close above 150 (blue line).
Bonnie’s ETFs to Watch Now
Figure 4: Performance week of 9/17/21 – 09/24/21 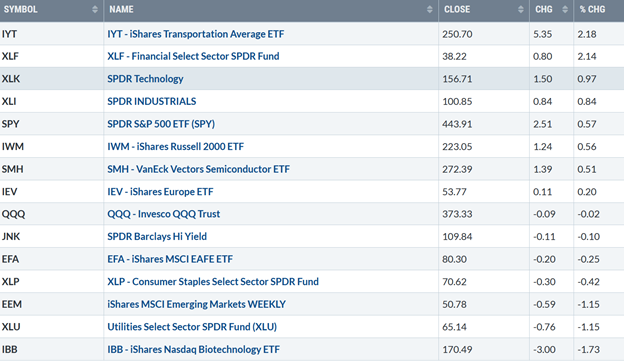
Source: Stockcharts.com
Positives
- Open-end high yield corporate bond funds closed lower last week but remained near new highs (Figure 5).
- The Nasdaq-line AD-Line made a higher low, forming a bullish rising double bottom (Figure 7).
- Optimism based on sentiment (contrary indicator) remains below the historical average. According to AAII Sentiment Survey, 9/22 rose by 7 to 29.9% bulls while bears stayed virtually the same, 30.9% bears. Source: American Association of Individual Investors.
- Transports (IYT) broke the short-term September downtrend, and MACD gave a buy. (Figure 9).
- The bullish Percent Index of Nasdaq, Dow, Consumer Discretionary, Industrials, and Materials turned up from oversold levels below 50.
Negatives
- Transports longer trend from May is down (Figure 8).
- The Nasdaq-line weekly AD-Line remains below where it broke down in July (Figure 8).
- September and October are volatile months, and historically when some of the worst bear markets have occurred.
- Semiconductors (SMH) have not broken out to the upside in price or momentum.
- The Russell 2000 weekly relative strength ratio to the S&P 500 (IWM/SPY) closed below July resistance (Figure 16).
Figure 5: LORD Abbett High Yield Fund
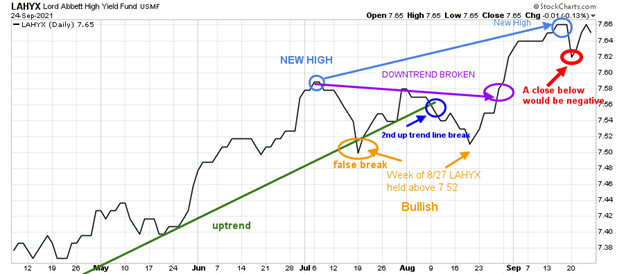
Source: Stockcharts.com
Lord Abbett High Yield, an open-end high yield corporate bond fund, broke its uptrend in July, a false breakdown, and then recovered to make a new high.
High-yield mutual funds, and high-yield ETFs such as HYG and JNK fell early in the week but remain stable and closed near their all-time highs. Immediate strength in high yields would be positive.
On the other hand, taking out the July low would warn of potential weakness in high yields and US equities.
Figure 6: Nasdaq New Highs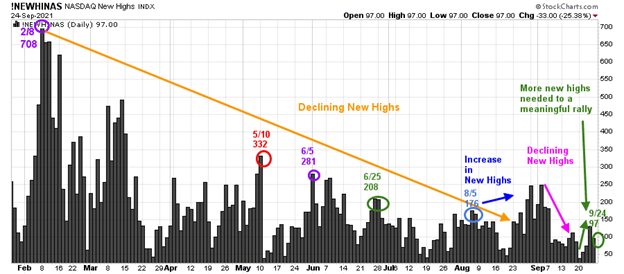
Source: Stockcharts.com
Although Nasdaq is near all-time highs, New highs remain well below the peak reading of 708 set on 2/8, closing at a paltry 97 on 9/24. A low reading of new highs is a warning of how narrow the Nasdaq underlying strength is.
Watch if new highs expand over 250 and then close above the 5/10 high of 332. It will be favorable if new highs increase and consistently have more new highs than lows over the next few weeks.
Early last week, there were more new lows than new highs, which is not a good sign.
However, this pattern changed on Thursday and Friday, where there were more new highs than new lows. If the trend of new highs outpaces new lows, this would be a sign of short-term strength for the Nasdaq. On the other hand, if the new lows outpace new highs, the odds increase of a market correction in the Nasdaq.
Figure 7: Daily Nasdaq Advance-Decline Line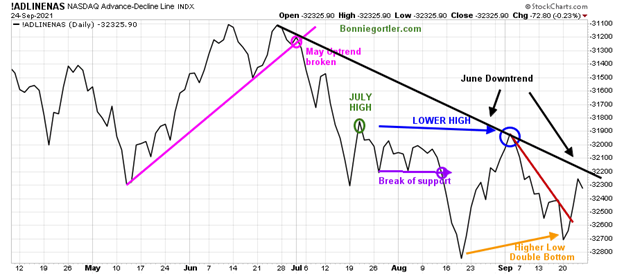
Source: Stockcharts.com
The Daily Nasdaq-line AD-Line broke down in July (pink line) and trended lower into August, making a lower high failing to take out the July high (green circle).
The Nasdaq-line AD-Line made a higher low, forming a bullish rising double bottom (orange arrow). The Nasdaq AD-Line first fell during the decline early in the week. However, The AD-Line turned up breaking the short-term September downtrend (red line). Positive breadth this week would break the June downtrend (black line) and be bullish for the short term.
On the other hand, negative breadth breaking the August low would cancel the double bottom pattern and be short-term bearish, implying more weakness to follow.
Figure 8: Weekly Nasdaq Advance-Decline Line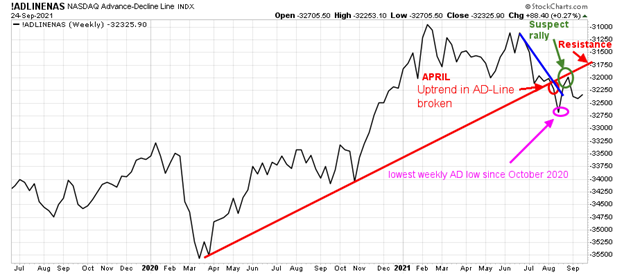
Source: Stockcharts.com
The Nasdaq-line AD-Line closed at its lowest low since October 2020 in early August. A suspect rally followed, failing to get above the uptrend line (red line), where it broke down in July (green circle). Breadth in Nasdaq continues to be weak.
A turn-up is needed penetrating the downtrend line (in red) over resistance for broad participation in Nasdaq stocks. If breadth weakens and takes out the August low, a more severe correction is likely.
Figure 9: Transportation Average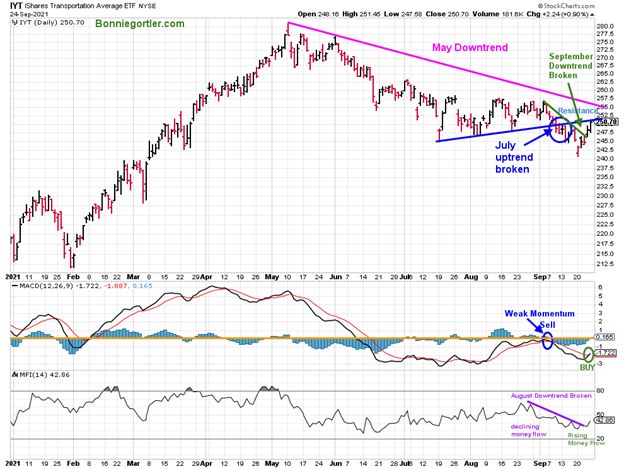
Source: Stockcharts.com
Transports have remained in a downtrend since May. However, it’s positive the short-term downtrend from September was broken. MACD generated a buy (middle chart) and a shift in money flow (lower graph) to rising from declining.
IYT was up 4.1% from its low of 240.70 before closing at 250.70, stopping at resistance. IYT is not out of the woods yet. It will be favorable if IYT closes above 257.50, breaking the May downtrend.
On the other hand, if IYT stalls and turns down, IYT could fall to the downside objective between 235.00 and 237.00.
Figure 10: Daily iShares Russell 2000 (IWM) Price (Top) and 12-26-9 MACD (Bottom)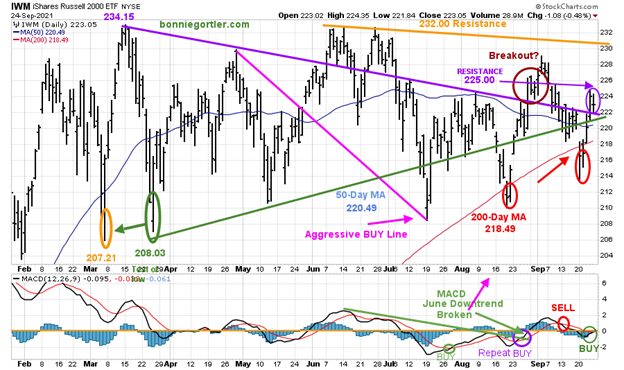
Source: Stockcharts.com
The top portion of the chart is the daily iShares Russell 2000 Index ETF (IWM), the benchmark for small-cap stocks, with a 50-day moving average (MA) (blue line) and 200-day moving average (MA), that traders watch and use to define trends.
IWM made a low on 3/5 at 207.21 (orange circle), then peaked at 234.15, followed by a decline to 208.03, successfully testing the March low. In June and July, IWM, after successive attempts to make a new high failed near 232.00 and turned lower, holding above the March low. IWM cleared 225.00 (resistance) at the end of August and above its 50-Day MA. However, IWM never closed above resistance at 232.00 and turned down.
After falling below the 50-Day MA and the 200-Day MA on 9/20, IWM held the March lows in a volatile week (red circle). The buyers stepped in, and IWM gained strength to close higher at 223.05 above 220.00 support but below resistance.
Support is at 220.00 followed by 218.00. A close below 213.57, 9/20 low, would imply another test of the March lows of 207.21 and potentially 198.00.
The bottom half of the chart is MACD (12, 26, 9), a measure of momentum. After breaking the June downtrend, MACD gave repeat buys in August but no meaningful rally. MACD is on a buy implying another rally towards 232.00 is possible.
Figure 11: Weekly iShares Russell 2000/S&P 500 (IWM/SPY) Relative Strength Ratio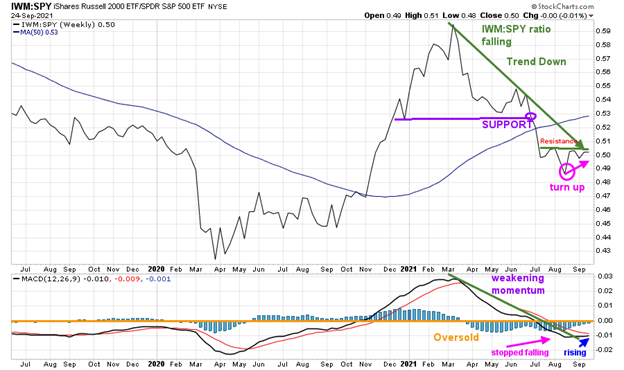
Source: Stockcharts.com
The weekly IWM/SPY ratio fell below support in June (purple line).
With the late August gains in IWM, the IWM/SPY ratio turned up. However, it failed to get through the July resistance and the July downtrend. It will be positive if the ratio gets over resistance at the August high.
MACD (in the lower chart) stopped falling and is now rising, a positive sign the decline may be coming to an end.
Figure 12: Daily Invesco QQQ Trust Nasdaq (QQQ) Price (Top) Money Flow (Bottom)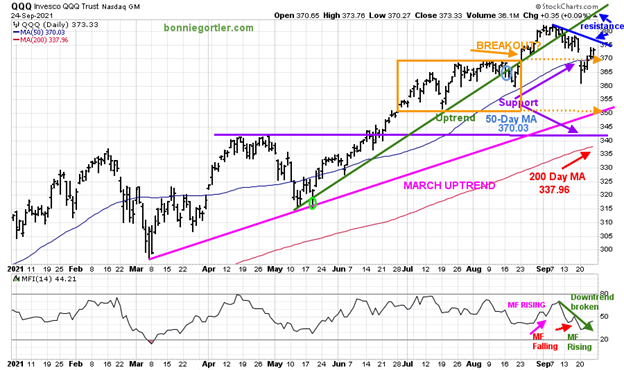
Source: Stockcharts.com
The chart shows the daily Invesco QQQ, an exchange-traded fund based on the Nasdaq 100 Index with its 50-day moving average and 200-day moving average.
The March uptrend (top chart) remains intact (pink line). In June, QQQ was in a trading range (orange rectangle) and then broke out to the upside in August.
QQQ fell below 370.00 support last week, where the QQQ broke out. However, no downside follow-through, and QQQ reversed higher.
Resistance is at 375.00. It would be positive if QQQ could break the September downside trendline. The upside objective remains at 390.00, a likely area to stall that coincides with the May uptrend line (green line) if QQQ continues rising.
In the lower chart, money flow shifted from rising to falling (green line). I want to see support at 370.00 holds on any pullback early in the week.
If QQQ closes below, it's likely to test this week low of 360.93. The following support is 350.00 followed by 340.00 (purple line) with the 200-day MA, just below 337.96 at this writing.
Figure 13: Weekly Financial Select Sector SPDR (XLF) Price (Top), XLF/S&P 500 (XLF/SPY) Relative Strength Ratio (Middle) and Weekly 12-26-9 MACD (Bottom)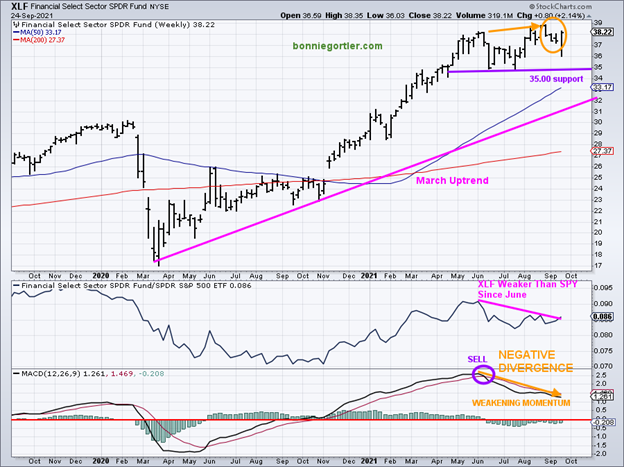
Source: Stockcharts.com
XLF (top chart) reversed sharply, closing at its high (green circle) after testing daily support (chart not shown) and holding above weekly support at 35.00 (purple line).
In the middle chart, the Financial Sector (XLF/SPY) ratio turned up but has remained in a downtrend, weaker than the S&P 500 since June.
In the lower chart, MACD is on a sell (purple circle) and falling, not yet in an oversold condition. MACD has not confirmed June’s high in XLF. A negative divergence remains, implying a potential shift in trend. (A negative or bearish divergence forms when the price makes higher highs, and MACD makes a lower high). With a bearish weekly chart and MACD not oversold and below 0, new entries are risky.
Figure 15: Apple (AAPL) Daily 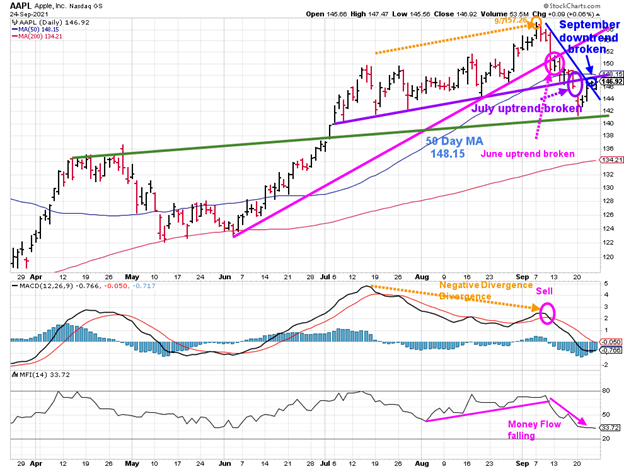
Source: Stockcharts.com
Apple (AAPL) peaked on 9/7/21 at 157.26 (orange circle). AAPL then declined to fall below its June uptrend (pink circle) and below its 50-day moving average later in the month.
AAPL closed at 146.92. Its positive AAPL broke its short-term September downtrend (blue line) but not yet closed above the 50-day MA or above the July uptrend (purple line).
Support is at 144, 141.00, followed by 133.00. Resistance is at 148.00, 150.00, and 155.00.
MACD (lower chart) is on a sell with money flow are falling. New buys are risky until momentum patterns are more favorable and AAPL closes above 148.00.
Sector to Watch for Leadership This Week
Figure 16: Van Eck Semiconductors (SMH) Daily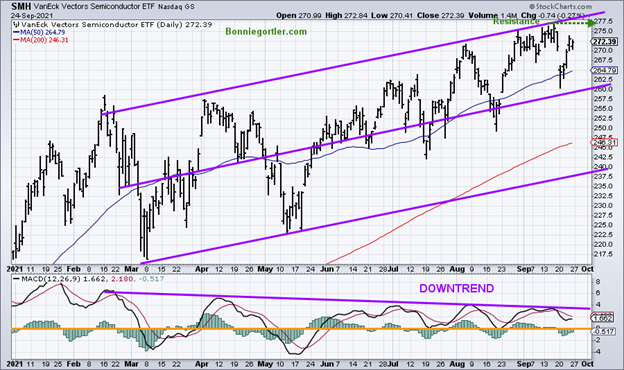
Source: Stockcharts.com
Semiconductors have not yet broken out to the upside in price or momentum. It will be bullish if Semiconductors lead the major averages higher.
Summing Up:
The major averages finish higher in a volatile week closing with back-to-back small changed weeks on high volatility, which leads me to believe a big move is coming. Rising yields, expectations for a tighter Federal Reserve monetary policy, and concerns about Chinese real estate developer Evergrande continue. Market breadth on the NYSE and Nasdaq remains concerning and essential to watch for signs of improvement or deterioration to guide going forward. It's key for Semiconductors, Nasdaq Trust (QQQ), Russell 2000 (IWM), and Transportation (IYT) to get through resistance or hold support early in the week for stocks to rally.
Remember to manage your risk, and your wealth will grow.
I would love to hear from you. If you have any questions or comments or would like to talk about the market, email me at Bonnie@Bonniegortler.com or contact me here.
Disclaimer: Although the information is made with a sincere effort for accuracy, it is not guaranteed that the information provided is a statement of fact. Nor can we guarantee the results of following any of the recommendations made herein. Readers are encouraged to meet with their own advisors to consider the suitability of investments for their own particular situations and for determination of their own risk levels. Past performance does not guarantee any future results.


